Solutions to Assignment #3 and #4
12-9
- a) Linear and direct
- b) Curvilinear and inverse
- c) Curvilinear and inverse
To Top
12-21
- a) Calculation of the regression parameters:
|
T |
S |
T*S |
T2 |
|
2.6 |
95 |
247 |
6.76 |
|
3.7 |
140 |
518 |
13.69 |
|
2.4 |
85 |
204 |
5.76 |
|
4.5 |
180 |
810 |
20.25 |
|
2.6 |
100 |
260 |
6.76 |
|
5.0 |
195 |
975 |
25.00 |
|
2.8 |
115 |
322 |
7.84 |
|
3.0 |
136 |
408 |
9.00 |
|
4.0 |
175 |
700 |
16.00 |
|
3.4 |
150 |
510 |
11.56 |
| Total |
34.0 |
1371 |
4954 |
122.6 |
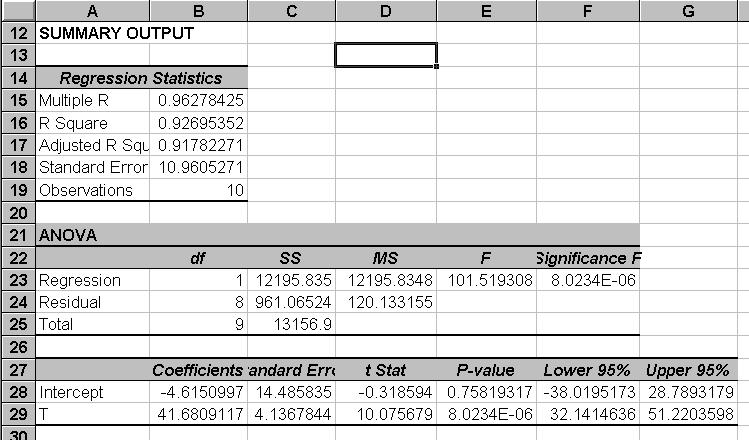
b= (4954 - 10 * 3.4 * 137.1)/(122.6 - 10 * 3.42) =
41.6809
a= 137.1 - 41.6809 * 3.4 = - 4.6151
The estimated regression line is then S = -4.6151 + 41.6809 * T
- b) The question is about the slope of the estimated line. Sales
appear to increase by 41.68 units per point increase in test score
- c) S = -4.6151 + 41.6809 * 3.4 = 137.1
Click for
Excel Regression output
To Top
12-30
The easiest way to calculate the coefficient of determination is to
use the computational formula:
All the quantities needed in this formula with the exception of the
"sum of squared S" is already on hand from the solution of 21. Sum of
squared-S (first square the S values then sum) is 201,121.
r2 = (-4.6151*1371 + 41.6809 * 4954 - 10 * 137.1 *
137.1)/(201,121 - 10 * 137.1* 137.1) = 0.92695
The Sample Correlation Coefficien is the square-root or r =
0.96278
To Top
12-33
- n= 25
- b= 1.12
- se=8.516
- (SX2 - n X 2)
= 327.52
- a) sb = se[(1/(SX2
- n X 2) ]1/2 = 8.516 * (1/327.52)1/2 =
.470606
- b)
t = (b - B) / sb = 1.12/.0470606 = 2.37991
Critical t = 2.069 ( two-tail with 23 df)
Thus reject the Null
Alternatively p-value = .02 (From Excel function tdist (2.37991,
23, 2) )
leading to the same conclusion
- c) B e { b +/- ta* s b}= 1.12 +/- 2.069 *
0.470606 = from 0.146478 to 2.09322.
To Top
- 12-37
Click for
Excel output for part a) and part b
To Top
- 13-30
-
-
- Tourist = 5.918 + 3.547 * Rate -0.171 * Price + 0.243 * Promot
+ 0.227 * Temp
- b )
- Ho: B1 = 0
- H1 : B1 <> 0 ( Not zero)
- t - stat for b1 =1.168398656
Critical t value for .10 level of significance ( .05 on either tail)
with n-k-1 = 7 df is 1.895
Accept the null Hypothesis. Alternatively the p-value is 0.2809 leading
to the same conclusion
- c)
- Ho: B3 = .2
- H1 : B 3 > .2 (..by more than..")
- t stat = (0.242552957 - 0.2)/0.162831605=
0.261331069
- Since the critical t value with n - k - 1 = 7 df at 10% (two
tail) is 1.895 we cannot reject the null hypothesis
- d) The 95% confidence interval for B4 is {b 4
+/- ta* sb4}
= 0.2273 +/- 2.365 * .1189 =
from -0.0539 to .5085
To Top