Summary of Hypothesis Testing:
Make an assumption about a population
Take a random sample from the population
Calculate an appropriate test statistic from the sample
Identify the sampling distribution of the statistic
Judge if the sample statistic is too extreme to maintain the assumption about the population.
- Using a critical value for the test statistic (traditional method)
- Using the p-value
Example:
- m = 5 (assumption about a population-- the null hypothesis)
(suppose we know s = .05)
- Take a random sample of 10 observations.
- Calculate sample mean, say X-bar is 5.04
At this point although we could have proceeded with X-bar as the test statistic, it is more consistent with the material to come later, to compute the corresponding z value (standard normal variate) and use it as the test statistic.
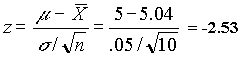
- Sampling distribution of the test statistic is standard normal (z)
- Decision:
- Using critical value: At a level of significance of 5% the critical z value is 1.645. Thus since the test statistic, z is 2.53 we consider the deviation of .04 (between the sample mean and assumed population mean) too extreme, and reject the null. (Excel tip: =NORMSINV(.05) returns 1.645)
- Using p-value: the probability of observing a z value of 2.53 (or more extreme) is 0.005703. This is such an unlikely observation that the null hypothesis is rejected. (Excel tip: =NORMSDIST(2.53) returns 0.005703)
Note: If the population variance were not known , it would have been estimated from the sample, and the appropriate test statistic would have been the student’s t rather than the standard normal distribution.