Solving Linear Programming Problems Using EXCEL
Most spreadsheet programs have the capability to solve small linear programming problems. Excel has a tool called SOLVER that solves various mathematical programming problems. This note describes the use of SOLVER to solve a linear programming problem. To do this you (1) create a worksheet representation of the model; (2) define the problem to the solver add-in (3) solve the problem; (4) view and/or print the results and (5) save the problem and/or the results.
1. Worksheet representation of the model:
The problem can be represented in a wide variety of ways. There is no rigid form requirement. The only requirements are that you have cells for the problem variables; a formula representing the objective function; and formulas representing the left hand sides of the constraints. Although many formats are possible, one widely used format arranges the spreadsheet representation of the problem as they are generally written. i.e., rows representing constraints and columns representing variables. For instance, to solve
           Max   5000E + 4000F
          ST.      10E + 15F <=150
                   20E + 10F <=160
                   30E + 10F >=135
                     E -  3F <=0
                     E +   F >=5
                     E, F>=0
Consider the following worksheet for the same problem
Here column A is used for descriptive labels for various
rows; B and C are used for the two variables. Row 2 contains the objective
function coefficients, row 3 quantities (solution), and finally rows 7-11
represent the constraints. The objective function is represented as a formula =
B2*B3 + C2*C3 in D5 (or a better way is SUMPRODUCT(B2.C2,$B$3.$C$3) which is entered to cell D5. Column labeled LHS contains formulas to calculate the left-hand sides of the respective constraints, e.g., D7 has the formula =B3*B7+ C3*C7 (or the SUMPRODUCT form) etc. In fact, if you write the formula in D7 as SUMPRODUCT(B2..C2,$B$3..$C$3) you can simply copy it to cells D8 through D11. Finally column labeled RHS contains the Right hand sides or the constants of the constraints.
2. Defining the problem for the Solver.
You must define the problem for the solver by identifying several things:
- Objective function cell (In the example this is
cell D5).
- Whether you are maximizing or minimizing (here Max)
- The range of cells containing the problem variables (Excel's term is changing variable cells). In the
example this is the range B3..C3.
- Constraint Formulas --Excel formulas representing the left hand sides (LHS) of the constraints. (In the example this the range D7..D11).
To define the problem, first
select Data on the ribbon , then Solver from the menu. This will bring the Solver Parameters dialog box. Move the insertion cursor
to "Set Objective "" box, point to the address of the objective function (this has to be a formula, here D5). Select the Min or Max radio button (Max here). Move the insertion cursor to By Changing Variable Cells box and enter or point to the range of variables (here B3..C3). Push the Add button to get the Add constraint dialog box. Enter (or point to) the cell containing the LHS of the first constraint (has to be a formula, here D7) in the box on the left , choose the appropriate logical operator (<=, >=, or =)
(here <=) move the insertion point to the right box and enter the adress of
the RHS of this constraint which is E7. Do this for all constraints
by clicking add tab repeatedly. When all constraints
are entered click OK
Speed tip: You can enter more than one constraint at a time as long as they all have the same direction. For instance you could have entered the first two constraint together in one operation. In the add constraint dialog box in the "cell reference box" enter D7..D8, choose <=, and enter for constraint E7..E8. This would have taken care first two constraints. Notice that if all the constraints were the same type we could have been able to enter all the constraints at once. At this point you have defined the model for the solver.
The last thing to do is to
choose in the Select Solving Method "Simplex LP" and check "Make Unconstrained
variables Non-Negative" box. To solve the problem click the
Solve
button. You may get one of the following three messges:
-
"Solver found a solution. All Constraints and optimality conditions are satisfied" Normal termination--problem is solved.
-
"Solver could not find a feasible solution:" means there is not even one set of values which staisfy all the constraints--infeasible problem
-
"The Objective Cell values do not converge" means there is no limit to the objective function value.
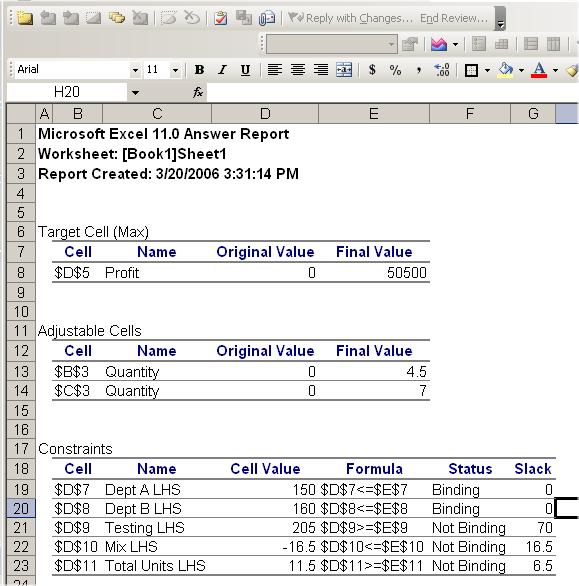
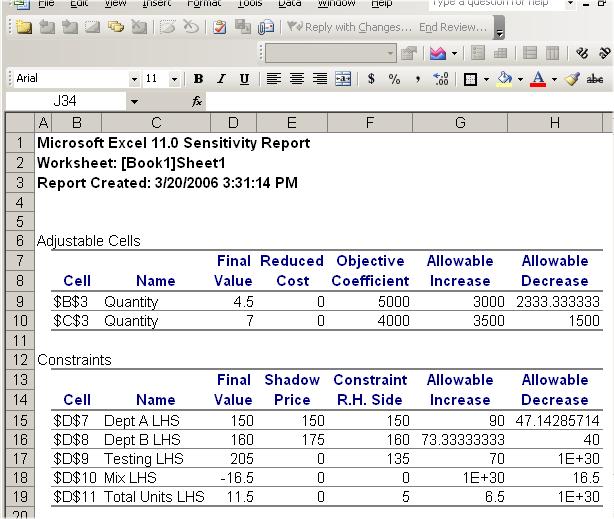
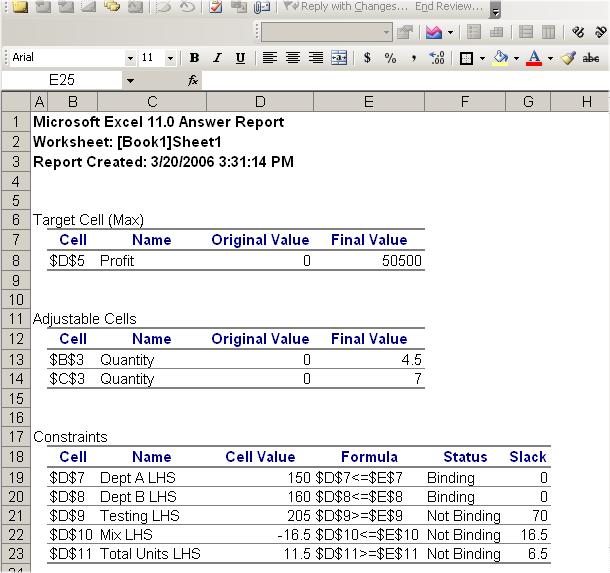
3 Reports
In
the event of normal termination, in addition to the optimal answer in the
worksheet itself, Solver provides additional output on the current problem these
are provided as Excel worksheets for viewing, saving or printing. From the
Solver results dialog box choose any or all of the three reports (Answer , Sensitivity , Limits) and click
OK .