Last Updated: August 16, 2017 5:16 AM
First published: Jul 5, 2017
http://www.dell.com/en-us/work/shop/productdetails/optiplex-7450-aio
Manuals - User Guide etc. - http://www.dell.com/support/home/us/en/19/product-support/product/optiplex-7450-aio/manuals
configuration as tested $1212.60 (list $1732.28)
options
Cypress UCMclient - UcmCx type C messaging connection manager UCM client peripheral driver for ? USB-C (data only) maybe?
mstar (http://www.mstarsemi.com/ ASIC) tsumu88cdt9-1 chip - for video, maybe HDMI in?
http://www.primatelabs.com/geekbench/download/windows/
| performance | 7450 AIO | yoga 370 | XPS 13 9365 2-in-1 i7-7Y75 4.1.0 |
XPS 13 9360 late 2016 i7 4.1.0 |
Yoga 910 |
Yoga Book 4.0.0 | XPS 13 2016 i7 single-core 3.4.1 x32 | XPS 13 2016 i7 multi-core | XPS 13 2016 i5 single-core v3.3.2 x32 | XPS 13 2016 i5 multi-core | P50 single-core | P50 multi-core | Surface Book single-core | Surface Book multi-core | ThinkPad Yoga 12 single core |
ThinkPad Yoga 12 multi-core | X1C3 |
X1C3 multi-core score |
Dell E7450 single | Dell 7450 multi | Apple MBP13r (early 2015) single | Apple MBP13r (early 2015) multi | Asus UX501 single core | Asus UX501 multi-core | X1C2 |
X1C2 4300U multi-core |
ThinkPad Yoga 4200U single |
ThinkPad Yoga 4200U multi |
| single-core | 4643 | 4001 | 4210 | 4684 | 4174 | 1054 | ||||||||||||||||||||||
| multi-core | 11551 | 6634 | 7561 | 9046 | 7677 | 3124 | ||||||||||||||||||||||
| 3.x | 3220 | 6828 | 2902 | 6043 | 2616 | 10504 | 3370 | 6991 | 2686 | 5364 | 2738 | 5411 | 2846 | 5661 | 2908 | 6133 | 3299 | 12089 | 2770 | 5289 | 2560 | 4777 | ||||||
| integer | 3160 | 7467 | 2801 | 6691 | 2792 | 11812 | 3353 | 7826 | 2649 | 5913 | 2688 | 5948 | 2880 | 6331 | 3009 | 7090 | 3384 | 13871 | 2716 | 5975 | 2454 | 5282 | ||||||
| floating point | 3134 | 7740 | 2719 | 6572 | 2779 | 13494 | 3294 | 7776 | 2638 | 5867 | 2678 | 5935 | 2872 | 6388 | 3019 | 7029 | 3396 | 14808 | 2696 | 5752 | 2444 | 5214 | ||||||
| memory | 3515 | 3730 | 3471 | 3690 | 1941 | 1912 | 3560 | 3755 | 2860 | 3260 | 3959 | 3292 | 2729 | 2871 | 2487 | 2429 | 2939 | 3091 | 3030 | 2992 | 3004 | 2897 | ||||||
| OpenCL | not compatible | 18252 | 18941 | 29363 | 19953 | 6582 |
v2.54
| 7450 AIO | yoga 370 | Dell XPS 13 9360 | Dell XPS 13 2-in-1 9365 | Yoga 910 | Yoga Book | XPS 13 2016 i7 | XPS 13 2016 i5 | P50 | Surface Book | ThinkPad Yoga 12 | X1 Carbon Gen 3 | Dell XPS 13 2015 5200U | MBP13r2015e VM | Asus UX501 | X1 Carbon Gen 2 4300U | ThinkPad Yoga 4200U |
X1 Carbon W8E32 (v2.54) |
T430s (v2.53) | T420s (v2.53) | |
| Linepack (GFlops) | 95.5253-100.0948 | 31.7734-33.5196 | 36.1264-45.8907 | 24.4657-33.4242 | 36.2323-44.4500 | 5.2145-8.3381 | 35.9385-44.8161 | 39.7464-40.0286 | 67.9432-68.5681 | 41.0359-46.9162 | 32.6463-33.5862 | 32.4892-36.3534 | 34.6988-35.6970 | 30.5470-38.5278 | 69.7684-75.0862 | 24.2526-27.5642 | 29.4538-32.9418 | 26.6-26.9 | ~35-36 | ~28-29 |
| time (s) | 8.930-9.358 | 26.668-28.133 | 19.479-24.743 | 26.744-36.536 | 20.110-24.671 | 107.205-171.424 | 19.946-24.873 | 22.331-22.490 | 13.036-13.156 | 19.053-21.783 | 26.615-27.381 | 24.589-27.513 | 25.013-25.761 | 23.201-29.263 | 11.905-12.812 | 32.429-36.857 | 27.135-30.349 | 33.2-33.5 |
http://en.wikipedia.org/wiki/Windows_System_Assessment_Tool
| MB/s |
7450 AIO | yoga 370 | Dell XPS 13 9360 | XPS 13 2016 | P50 | Surface Book | ThinkPad Yoga 12 | X1 Carbon Gen 3 | Dell E7450 | MBP13r2015e i5-5257U 2.7GHz 16GB RAM Parallels VM | ThinkPad Yoga | X1 Carbon Gen 2 | Helix | X1 Carbon W8E32 | Taichi | T430s | T420s |
W520 | T510 | T400/W500 |
| CPU LZW Compression |
625.00 | 333.67 | 330.56 | 301.74 | 531.20 | 342.62 | 223.87 | 224.28 | 243.04 | 210.4 | 238.02 | 238.65 | 206.07 | 174.59 | 243.92 | 267.54 | 220.56 |
495.30 | 171.94 | 119.46 |
| CPU AES256 Encryption |
2956.84 | 2435.44 | 2595.67 | 1535.74 | 268.10 | 1792.68 | 1194.67 | 1240.40 | 1290.37 | 802.01 | 1235.14 | 1263.36 | 100.92 | 83.69 | 117.71 | 129.63 | 106.00 | 228.19 | 77.55 | 62.17 |
| CPU Vista Compression |
1672.81 | 897.59 | 907.13 | 755.83 | 1363.39 | 883.12 | 619.26 | 616.20 | 664.58 | 555.69 | 636.75 | 637.11 | 553.80 | 601.28 | 650.05 | 719.58+ | 745.99 | 1311.40 | 569.76 | 368.56 |
| CPU SHA1 Hash | 2196.65 | 1362.76 | 1194.82 | 844.24 | 1886.50 | 1012.66 | 776.25 | 915.12 | 842.94 | 904.49 | 773.47 | 958.79 | 633.67 | 545.80 | 739.87 | 891.80 | 653.23 | 1397.21 | 420.36 | 568.14 |
| Uniproc CPU LZW Compression |
163.76 | 163.88 | 159.09 | 122.79 | 98.96 | 140.69 | 92.78 | 94.20 | 101.36 | 105.46 | 88.0 | 101.89 | 83.63 | 68.99 | 99.44 | 107.72 | 78.42 | 94.79+ | 69.51 | 61.87 |
| Uniproc CPU AES256 Encryption | 780.53 | 799.87 | 817.16 | 426.42 | 68.02 | 502.98 | 348.78 | 348.94 | 374.74 | 401.22 | 336.45 | 375.10 | 52.10 | 39.29 | 60.44 | 66.43 | 46.34 | 59.53 | 38.03 | 32.76 |
| Uniproc CPU Vista Compression | 440.15 | 446.72 | 434.19 | 319.12 | 250.45 | 365.86 | 246.50 | 248.56 | 267.06 | 279.36 | 226.55 | 263.23 | 208.13 | 237.40 | 243.24 | 273.65 | 261.65 | 251.55+ | 207.42 | 194.03 |
| Uniproc CPU SHA1 Hash | 581.24 | 559.80 | 607.86 | 421.91 | 389.91 | 512.41 | 396.99 | 396.57 | 427.02 | 456.57 | 383.90 | 428.47 | 357.95 | 304.14 | 413.22 | 420.78 | 319.53 | 343.79+ | 238.53 | 297.66 |
| Dshow Video Encode Time (s) | 1.03042 | 1.81554 | 1.61497 | 2.37905 | 1.20129 | 1.99885 | 2.77823 | 2.78059 | 2.59370 | 2.76760 | 2.70669 | 2.67998 | 2.88483 | 2.75325 | 2.46806 | 2.45161 | 2.61391 | 1.45114 | 3.35620 | 5.31552 |
| Memory Performance | 25135.35 | 15970.68 | 30240.77 | 33141.31 | 9936.13 | 24221.42 | 15685.87 | 16124.03 | 15918.68 | 20998.80 | 15798.61 | 17305.41 | 12898.00 | 12785.98 | 14939.07 | 15768.97 | 13239.94 | 9235.90+ | 6194.03 | 5322.44 |
3.1
| 7450 aio | Dell XPS 13 2-in-1 9365 | Dell XPS 13 9360 | Yoga 910 | Yoga Book | Dell XPS i7 | Dell XPS i5 | |
| LuxBall HDR 217K | 2476 (1570 CPU) | 1594 (892 CPU) | 2191 (1104 CPU) | 2219 | 573 | 1868 | 1597 |
| Neumann TLM-102 SE 1769K | 1737 (1235 CPU) | 1272 (667 CPU) | 1779 (921 CPU) | 1431 | 378 | ||
| Hotel Lobby 4973K | 548 (320 CPU) | 324 (148 CPU - failed) | 534 (216 CPU - failed) | 441 | 82 |
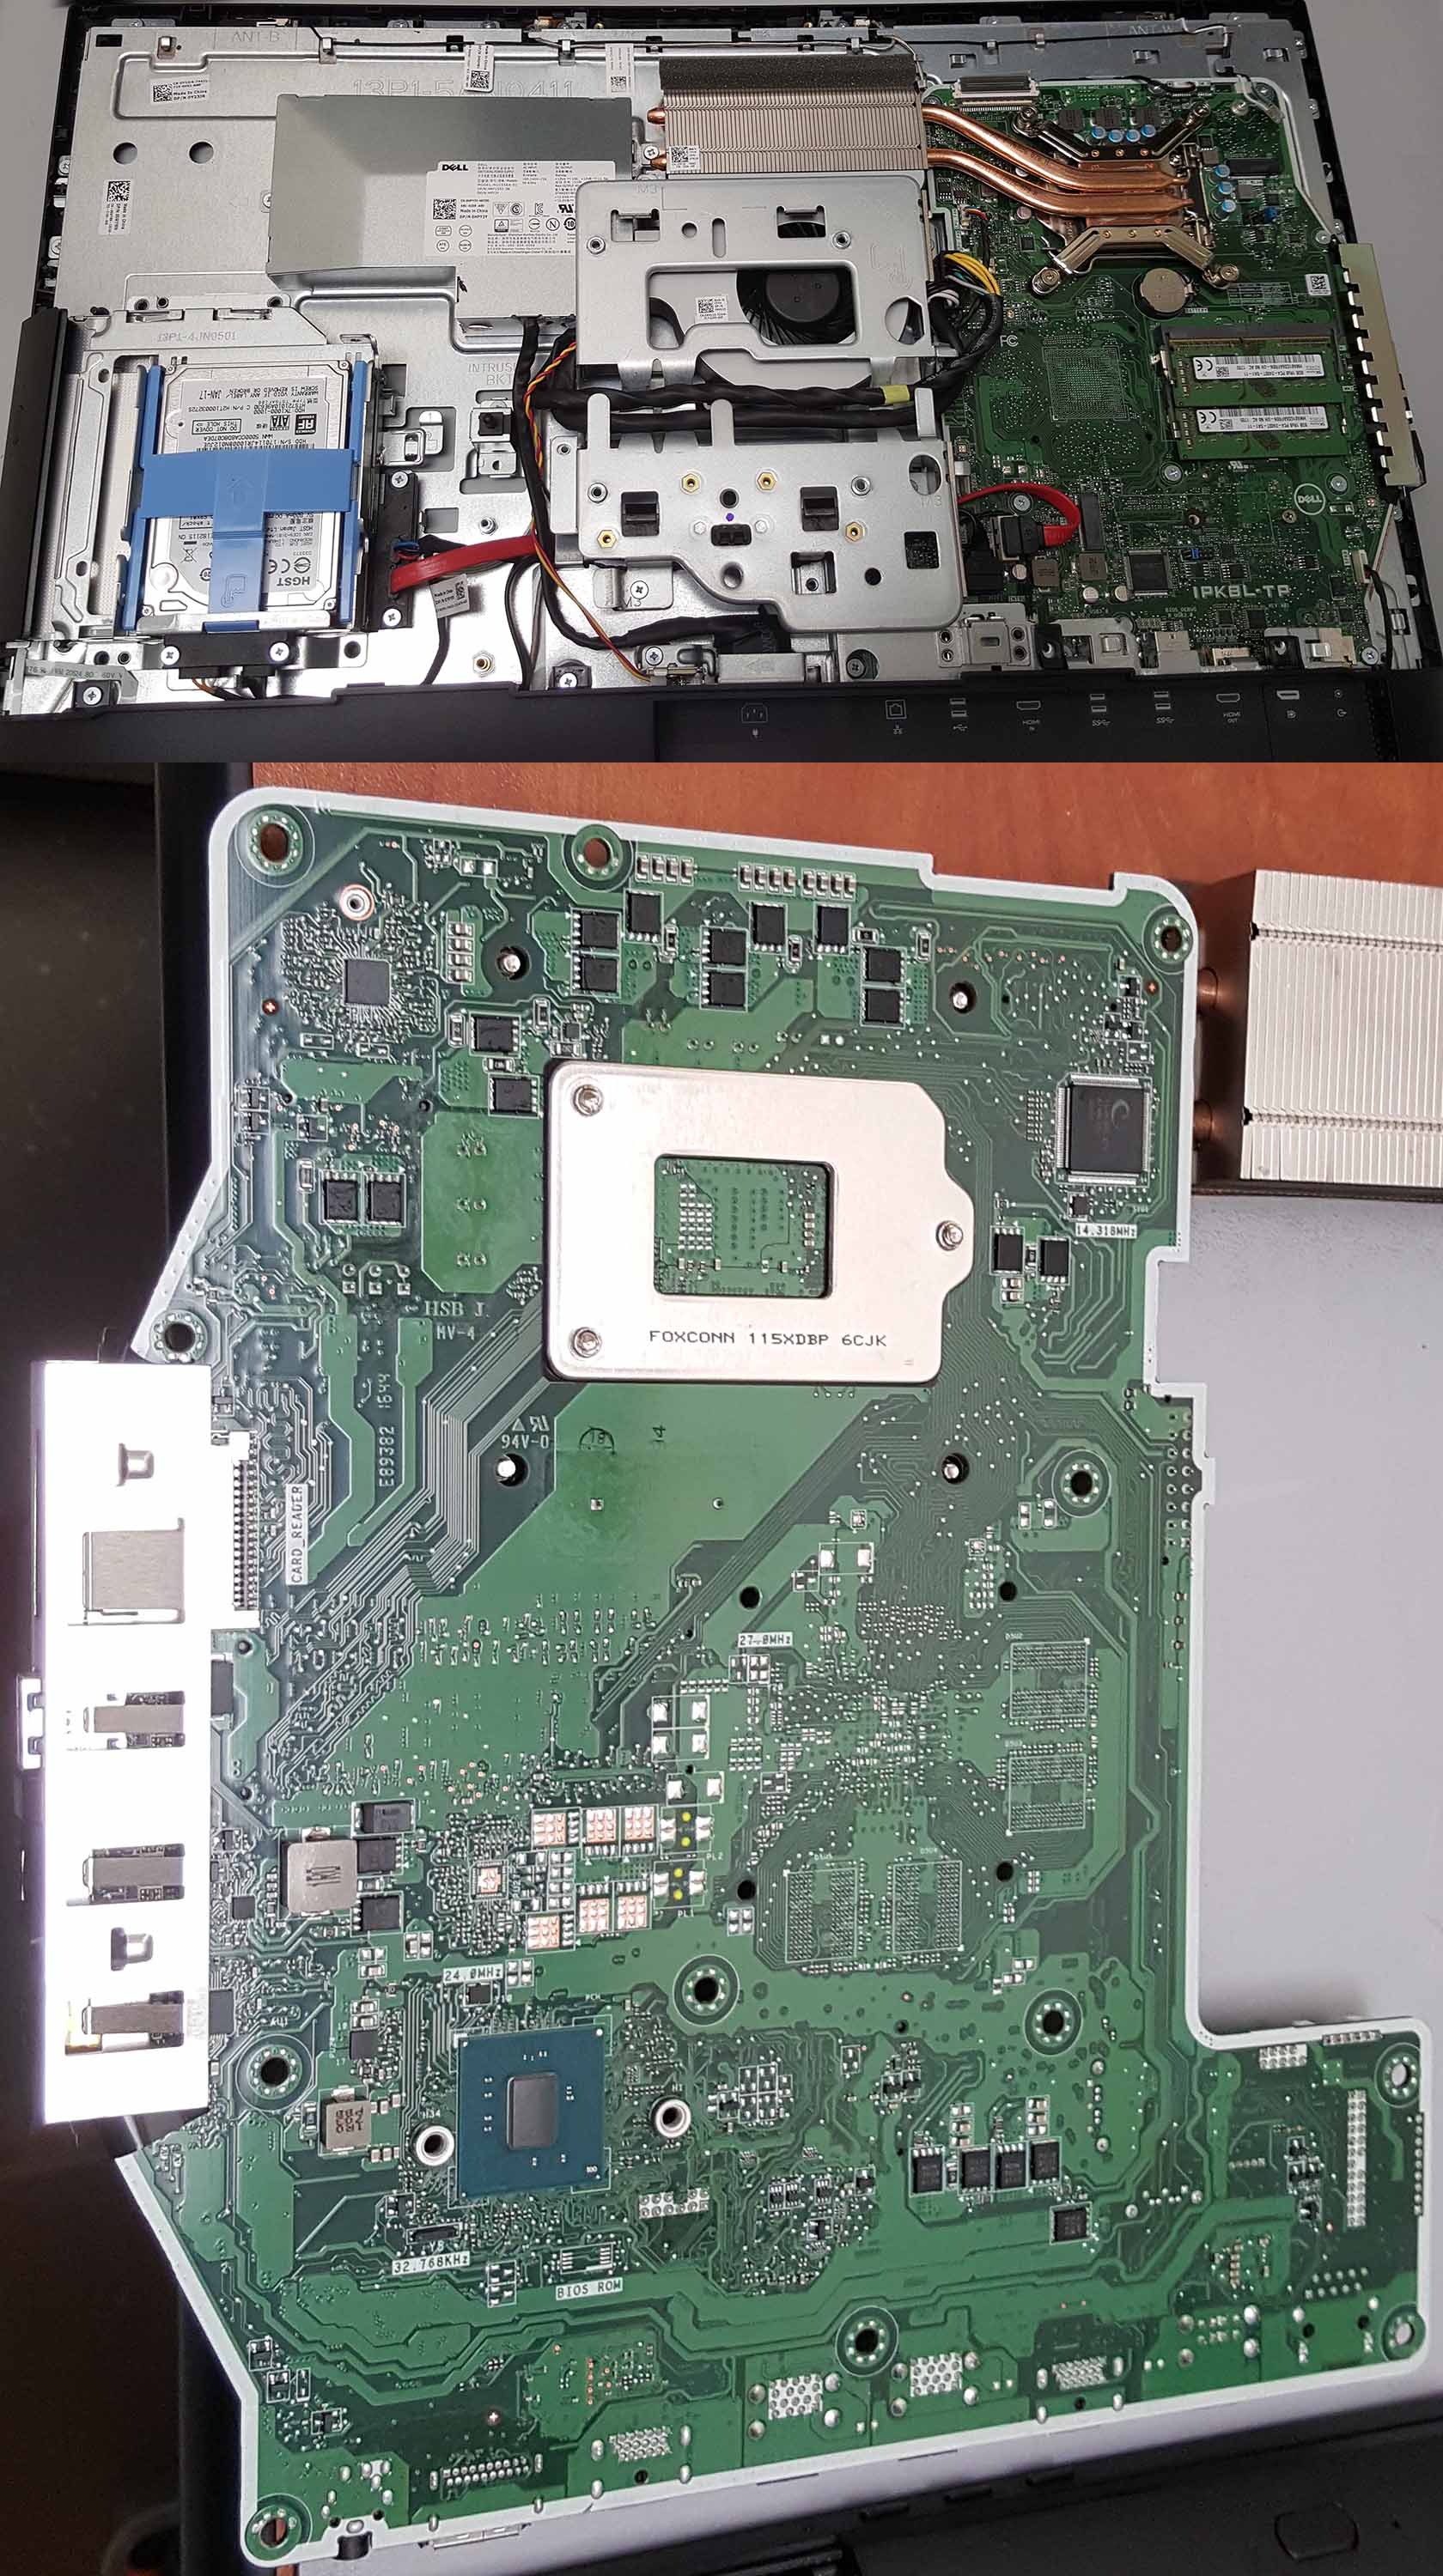
HGST HTS721010A0E630
http://crystalmark.info/software/CrystalDiskMark/index-e.html
5.2.1 x64
| 7450 AIO | Yoga 370 | Dell XPS 13 2-in-1 9365 | Dell XPS 13 9360 | Yoga 910 5.2.0 | Yoga Book | yoga 260 | Dell XPS 13 2016 Toshiba 512 | Dell XPS 13 2016 Samsung 256 (5.1.2 x64) | Dell XPS 13 2016 Toshiba 256 | P50 (5.1.2 x64) | P50 (5.1.1 x64) | Surface Book (5.0.2 x64) | 5.x | ThinkPad Yoga 12 | X1 Carbon Gen 3 | Dell E7450 | Dell XPS 13 2015 | Asus UX501 | Yoga | 3.03 X1 Carbon Gen 2 | 3.02e Helix | 3.02e-X1 Carbon Win8E32 | 3.01-X1 Carbon Win7-64 W520 Intel 520 | 3.01-Win7-64 T430s Samsung 830 | ||||||||||||||||||||||||||
| [MB/s] | R | W | R | W | R | W | R | W | R | W | R | W | Read | Write | Read | Write | Read | Write | Read | Write | Read | Write | Read | Write | Read | Write | Read | Write | Read | Write | Read | Write | Read | Write | Read | Write | Read | Write | Read | Write | Read | Write | Read | Write | Read | Write | Read | Write | ||
| Seq | 126.1 | 120.0 | 1212 | 1549 | 1260 | 995.8 | 1190 | 979.2 | 3270 | 1618 | 147.0 | 42.58 | 464.3 | 445.0 | 1506 | 1366 | 1200 | 294.5 | 1451 | 961.8 | 1711 | 1538 | 1623 | 1531 | 891.0 | 303.7 | 523.4 | 238.1 | 529.3 | 241.6 | 490.5 | 264.1 | 476.9 | 265.6 | 1391 | 1401 | 503.4 | 418.0 | 482.6 | 318.2 | 445.8 | 183.5 | 429.6 | 178.1 | 433.4 | 247.1 | 487.9 | 403.5 | ||
| 512K | 439.7 | 241.6 | 431.7 | 240.9 | 387.7 | 258.4 | 385.5 | 265.1 | 1004 | 1264 | 377.7 | 402.8 | 421.9 | 312.6 | 339.4 | 194.1 | 375.2 | 177.1 | 353.5 | 239.0 | 342.6 | 389.2 | ||||||||||||||||||||||||||||
| Seq Q32T1 | 124.7 | 121.2 | 3115 | 1612 | 1687 | 1049 | 1584 | 614.9 | 1877 | 1612 | 126.0 | 42.70 | 542.6 | 512.7 | 1709 | 1380 | 1551 | 299.4 | 1709 | 907.6 | 2265 | 1511 | 2293 | 1521 | 1574 | 308.4 | ||||||||||||||||||||||||
| 4K | 0.461 | 0.963 | 42.89 | 131.9 | 39.75 | 162.1 | 32.65 | 171.3 | 35.81 | 186.8 | 15.13 | 12.91 | 29.55 | 96.55 | 45.90 | 149.1 | 42.34 | 130.8 | 44.62 | 122.7 | 57.24 | 207.9 | 57.44 | 205.9 | 40.51 | 108.1 | 35.78 | 103.4 | 35.83 | 103.2 | 23.09 | 97.25 | 21.27 | 97.20 | 40.20 | 90.03 | 33.95 | 86.38 | 38.81 | 99.90 | 21.42 | 43.33 | 19.66 | 41.43 | 19.67 | 48.08 | 22.34 | 55.89 | ||
| 4K QD32 | 391.3 | 240.9 | 354.8 | 240.1 | 393.1 | 255.7 | 386.8 | 263.5 | 311.0 | 316.7 | 326.8 | 291.9 | 201.1 | 124.1 | 266.2 | 167.4 | 132.7 | 174.2 | 229.7 | 231.6 | 303.6 | 151.3 | ||||||||||||||||||||||||||||
| 4K Q32T1 | 0.839 | 0,992 | 368.6 | 388.5 | 542.6 | 432.5 | 625.3 | 422.2 | 592.3 | 512.0 | 33.33 | 16.70 | 307.4 | 289.0 | 507.2 | 326.7 | 437.4 | 304.5 | 437.1 | 117.0 | 525.7 | 415.0 | 520.3 | 420.0 | 402.2 | 270.2 | ||||||||||||||||||||||||
http://www.attotech.com/products/product.php?sku=Disk_Benchmark
3.05
0http://www.maxon.net/products/cinebench/overview.html
R15
| 7450 AIO | XPS 13 9360 | XPS 13 2016 i7 | XPS 13 2016 i5 | P50 | Surface Book | ThinkP Yoga 12 | X1 Carbon Gen 3 | Dell E7450 | MBP13r2015e | MBP13r2015e i5-5257U 2.7GHz 16GB RAM Parallels VM | Asus UX501 | ThinkPad Yoga | |
| OpenGL (fps) | 54.11 | 46.63 | 47.50 | 41.93 | 56.83 | 30.58 | 28.96 | 28.38 | 30.91 | 25.43 | 25.39 | 91.86 | 24.5 |
| Ref. Match | 97.8% | 97.8% | 97.8% | 97.8% | 99.6% | 99.6% | 98.0% | 98.0% | 98.0% | 99.3% | 97.9% | 99.6% | 98% |
| CPU (cb) | 594 | 293 | 307 | 290 | 589 | 328 | 230 | 254 | 281 | 302 | 213 | 615 | 226 |
| CPU (Single Core) (cb) | 161 | 142 | 130 | 116 | 118 | 136 | 79 | 110 | 92 | 124 | 112 | 138 | 81 |
| MP Ratio | 3.68x | 2.06x | 2.36x | 2.50x | 5.00x | 2.41x | 2.91x | 2.30x | 3.49x | 2.43x | 1.90x | 4.46x | 2.45x |
4C/4T barely faster than 2012, 4 generations old, slower clock 4C/8T in Cinebench CPU?
http://www.ozone3d.net/benchmarks/fur/
http://www.geeks3d.com/20150828/furmark-1-17-0-gpu-stress-test-opengl-benchmark/
1.17.0.0
720 preset
| 7450 AIO | yoga 370 with TB3 eGPU 1080 | yoga 370 | XPS 13 2016 i7 | XPS 13 2016 i5 | P50 (max. 63 °C, min. 39°C) | Surface Book (max. 73 °C) | ThinkPad Yoga 12 (1.15.1.0) | X1 Carbon Gen 3 | Dell E7450 | Asus UX501 | X1 Carbon Gen 2 4300U | ThinkPad Yoga 4200U | X1 Carbon | |
| points | 792 | 10671 | 577 | 836 | 651 | 2928 | 1161 | 446 | 446 | 507 | 3958 | 346 | 413 | 423 |
| fps | 13 | 178 | 10 | 13 | 10 | 48 | 19 | 7 | 7 | 8 | 65 | 5 | 6 | 7 |
| 60000 ms | (min:13, max: 15) | (min:162, max: 181) | (min:6, max: 13) | (min:12, max: 20) | (min:11, max: 12 avg 10?) | (min:44, max: 60) | (min:19, max: 21) | (min 8, max 9 - avg 7?) | (min:7, max: 11) | (min:8, max:10) | (min:57, max: 80 - options:DynBkg) | (min:6, max:9) | (min:7, max:10) |
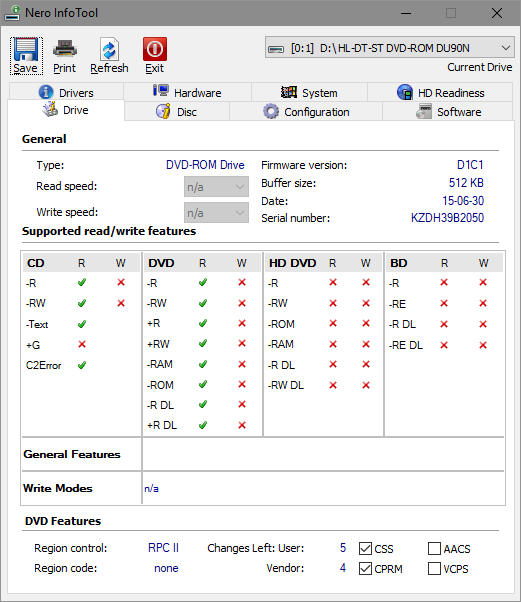
monitor
optical
driver revision D1C1
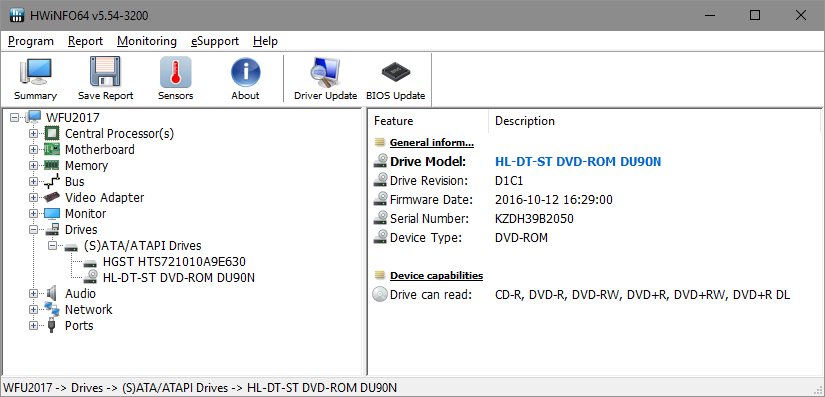
nero intotool 11.0.0050