Microsoft Surface Book
Last Update:
2015-11-10 1:54 PM
first posted:
2015-10-26
announced : 2015/10/06 http://www.microsoft.com/october2015event/en-us (starts 1h15m09s)
main page : http://www.microsoft.com/surface/en-us/devices/surface-book
forum - http://www.surfaceforums.net/forums/microsoft-surface-book.84/
user guide - http://www.microsoft.com/surface/en-us/support/userguides
(link to keyboard touchpad is wrong, go through http://www.microsoft.com/surface/en-us/support
, http://www.microsoft.com/surface/en-us/support?productId=110680900 , getting started http://www.microsoft.com/surface/en-us/support/getting-started/get-started-with-surface-book?os=windows-10 instead)
video - https://www.youtube.com/watch?v=XVfOe5mFbAE
so cute - Making the switch ... from MacBook - https://www.microsoft.com/en-us/switch/mac-surface/
update log - https://www.microsoft.com/surface/en-us/support/install-update-activate/surface-book-update-history?os=windows-10
Good
- finally a detachable that works mostly - earlier attempt like Asus Transformer Prime, Lenovo ThinkPad Helix not quite work out. main new feature - dGPU, drop dead gorgeous 3000x2000 screen, pen, incredible battery life
BAD
- the top and bottom don't close completely with a gap, understandable because of the strange hinge, still just weird and scary
- things fall in and damage the screen
- can get warm and fan noise - compromise you have to take, for work, still better than a weak fanless Core M
- you can feel tiny electrostatic on the metallic chassis with ac adapter plug in (happens to some MacBook Pro also), kind of annoying, it should have better isolation
- magnetic pen still an inconvenient, inside holder ("garage") still better
- no nVidia tray icon tell you when dGPU active, nVidia control panel has minimum settings, just manual/auto 3D control, add item to context menu
- detach mechanism takes some time, not as fast as physical switch
- pending fix - flashes of screen - http://www.theregister.co.uk/2015/10/28/microsoft_surface_book_problems/
- System Firmware Update – 11/2/2015 fixed it?
- HD Graphics 520 driver update (v20.19.15.4308) addresses some display issues, including some scenarios that result in screen flickering.
- Display audio driver update (v8.20.0.659) supports compatibility with the updated graphics driver.
- Surface Embedded Controller Firmware update (v88.855.257.0) improves system stability.
- Surface System Aggregator Firmware update (v88.853.258.0) improves the keyboard and trackpad experience.
- Surface Pen Settings driver (v10.0.302.0) adds support for future functionality on Windows 10.
- pending fix - slow wireless - need to regedit temporarily HKEY_LOCAL_MACHINESYSTEMControlSet001Servicesmrvlpcie8897 TXAMSDU 1->0 - http://www.ibtimes.co.uk/surface-pro-4-surface-book-having-slow-wi-fi-how-fix-1526643
- lid a little bit hard to open
- AC adapter pigtail too short
- no Thunderbolt 3
- no USB-C 3.1 (10Gbps)
- no Always On USB
- no HDMI (not on dock either)
- not quite 4K (3840x2160 vs 3000x2000)
- no Intel wireless adapters option
- no Bluetooth 4.1
- no WiGig
- no 4G LTE (not a big deal, easier to use phone hotspot or MiFi, especially if you have multiple device, not sure why people insists on having that internally)
- no fingerprint reader
- no SmartCard
- hard to fix - https://www.ifixit.com/Teardown/Microsoft+Surface+Book+Teardown/51972
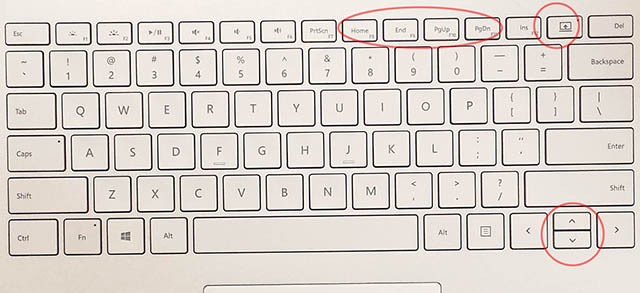
- keyboard bit soft
- different key layout
- half height up/down arrows (keyboard no need to be perfect rectangle, should be diamond shape for better affordance.)
- Home/End, Pg Up/Pg Dn should be in 2x2 or 1x4 vertical layout
- F1 - brightness down F2 - brightness up F3 - play/pause F4 - mute F5 - volume down F6 - volume up different from both ThinkPad and Mac
- detach key can be above keyboard
- Ctrl, Fn reverse of Lenovo ThinkPad
- Fn is a toogle - good thing, no need for Fn Lock
- no right Ctrl key
- seems reversed - keyboard backlit control main, need Fn+Del/Fn+Backspace for screen
- i miss the TrackPoint and mouse buttons ... ...
- and screen doesn't lay flat like X1 Carbon ... ...
- Windows logo not lit ;)
- rapidcharge?
- crapware - New York Times Crossword puzzle, Flipboard, Drawboard PDF - you are so close to clean image, Microsoft, why? show the OEM what NOT to do
- annoying Bitlocker waiting to be activated message - put a ! on your C:

- explorer taskbar crashed couple times - Windows 10 or hardware?
- problem not going to sleep after close lid, mouse cursor disappear
- eventvwr diagnostic performance poor boot, shutdown times - some degradation related to Creative Cloud Adobe Desktop Service.exe and Windows StateRepository API Server
- intel HD graphics driver crash (Windows 8?, not Windows 10?)

- BSOD - video_scheduler_internal_error
- Windows Update - try to reinstall already successful installed "System Hardware Update 10/23/2015 and failed?)
- Surface Camera drivers set (v30.10154.6640.152) enables the Windows Hello feature.
- Control Logic driver (v30.10154.6640.152)
- CSI2 Host Controller driver (v30.10154.6640.152)
- Imaging Signal Processor 2500 driver (v30.10154.6640.152)
- Microsoft Camera Front driver (v30.10154.6640.152)
- Microsoft Camera Rear driver (v30.10154.6640.152)
- Microsoft IR Camera Front driver (v30.10154.6640.152)
- Surface Camera Windows Hello driver (v1.0.24.0)
- AVStream Camera 2500 driver (v30.10154.6640.152)
- Surface Display Calibration driver (v1.1.371.0) improves the overall display stability.
- Surface Integration driver (v1.1.263.0) improves storage performance.
- Surface Storage Firmware Update driver (v1.447.0) improves storage performance.
- other bugs
Adobe Media Encoder
Pr 2015.0.2 release 9.0.2 (6) build unless noted
10 seconds 4K MP4 to H.264 high bitrate
| 28 seconds |
Asus ZenBook Pro UX501 i7-4720HQ 2.6/turbo 3.6 GHz GTX 960M 2GB GDDR5, 16GB, 512GB |
| 36 seconds |
Microsoft Surface Book i7-6600U 2.6/turbo 3.4 GHz (HD graphics 520 + dGPU), 8GB, 256GB |
| 52 seconds |
Lenovo Yoga 2 Pro 13 i7-4500 1.80GHz/2.40 GHz (*Pr 2014.2 release 8.2.0 (65) build) 8GB, 256GB |
| 53 seconds |
MacBook Pro 13" retina 2015 i5-5257U 2.7/turbo 3.1 GHz, 16GB, 256GB |
| 114 seconds |
Sony VAIO Pro 13 i7-4500 1.80GHz (low @0.79GHz) 8GB, 256GB |
CPU - Handbrake
http://handbrake.fr/
Handbrake - 2h10m Grandmaster 7.27GB DVD
| |
fps |
Model |
CPU |
clock |
RAM |
OS |
|
| 11m03s |
354 |
Surface Book |
i7-6600U |
2.6GHz (Turbo 3.4GHz) |
8GB |
Windows 10 64-bit |
0.10.2 Intel QSV |
| 14m26s |
270 |
ThinkPad Yoga 12 |
i5-5200U |
2.2GHz (Turbo 2.7GHz) |
8GB |
Windows 8.1 64-bit |
0.10.1 Intel QSV |
| 19m32s |
200 |
ThinkPad Yoga 12 |
i5-5200U |
2.2GHz (Turbo 2.7GHz) |
8GB |
Windows 8.1 64-bit |
0.9.8 (use the newer versions instead for work, this is for the purpose of comparison with older results only) |
| 15m46s |
247 |
X1C3 |
i5-5200U |
2.2GHz (Turbo 2.7GHz) |
8GB |
Windows 8.1 64-bit |
0.10.1 H.264 (x264) |
| 36m35s |
107 |
MBP13r2015e |
i5-5257U |
2.7GHz (Turbo 3.1GHz) |
16GB |
OS X 10.10.1 |
0.10.1 H.264 (x264) no Intel QSV |
| 11m03s |
353 |
Asus UX 501 |
i7-4720HQ |
2.6GHz (Turbo 3.6GHz) |
16GB |
Windows 8.1 64-bit |
0.10.1 Intel QSV |
| 19m28s |
|
X1 Carbon Gen 2 |
i5-4200U |
1.60GHz (Turbo to ? GHz) |
4/8GB |
Windows 8.1 64-bit |
|
| 21m33s |
181 |
X1 Carbon Gen 2 |
i5-4300U |
1.90GHz (Turbo to 2.12-2.17GHz) |
8GB |
Windows 8.1 64-bit |
Intel 240GB SSD |
| 19m29s |
200 |
ThinkPad S1 Yoga |
i5-4300U |
1.90GHz (Turbo to 2.23-2.33GHz) |
8GB |
Windows 8.1 64-bit |
Lite-On 256GB SSD |
| 20m56s |
186 |
Sony VAIO Pro 13 |
i7-4500U |
1.80GHz (runing at 1.60GHz even at 86% utilitzation using high performance profile, cannot Turbo to 3.0GHz) |
8GB |
Windows 8.1 64-bit |
|
| 16m32s |
236 |
X1 Carbon Touch |
i7-3667U |
2.00GHz (Turbo to 2.95GHz) |
8GB |
Windows 8 64-bit |
|
| 21m28s |
182 |
Surface Pro |
i5-3317U |
1.70GHz (Turbo to 2.38GHz) |
4GB |
Windows 8.1 64-bit |
|
| 17m00s |
229 |
T430s |
i5-3320 |
2.60GHz |
4GB |
Windows 7 32-bit |
|
| 10m01s |
389 |
M14R2 |
i7-3610QM |
2.30GHz |
16GB |
Windows 7 HP 64-bit |
mSATA boot, data on HDD |
| 19m27s |
200 |
T420s |
i5-2520 |
2.50GHz |
3GB |
Windows 7 32-bit |
Intel mSATA boot, not enough room, source on Seagate BackUp Plus FAST STDA4000100 USB 3.0 |
| 11m17s |
345 |
W520 |
i7-2720QM |
2.20GHz (Turbo to 2.69-2.97GHz |
16GB |
Windows 8 64-bit |
(Samsung 840 PRO RAPID mode enabled DXM06B0Q firmware |
| 26m50s |
145 |
T410 |
i5-M520 |
2.40GHz |
3GB |
Windows 7 32-bit |
|
Maxon CineBench
http://www.maxon.net/products/cinebench/overview.html
R15
| |
Surface Book |
ThinkP Yoga 12 |
X1 Carbon Gen 3 |
Dell E7450 |
MBP13r2015e |
MBP13r2015e i5-5257U 2.7GHz 16GB RAM Parallels VM |
Asus UX501 |
ThinkPad Yoga |
| OpenGL (fps) |
30.58 |
28.96 |
28.38 |
30.91 |
25.43 |
25.39 |
91.86 |
24.5 |
| Ref. Match |
99.6% |
98.0% |
98.0% |
98.0% |
99.3% |
97.9% |
99.6 |
98% |
| CPU (cb) |
328 |
230 |
254 |
281 |
302 |
213 |
615 |
226 |
| CPU (Single Core) (cb) |
136 |
79 |
110 |
92 |
124 |
112 |
138 |
81 |
| MP Ratio |
2.41x |
2.91x |
2.30x |
3.49x |
2.43x |
1.90x |
4.46x |
2.45x |
Unigine Heaven 4.0
https://unigine.com/products/heaven/
| |
Surface Book 1920x1080 High max. 78 °C |
Surface Book system 3000x2000 |
TP Yoga 12 Ultra |
TP Yoga 12 High |
X1C3 |
MBP13r2015 High |
MBP13r2015 Med |
Asus UX501 high |
Asus UX501 medium |
ThinkPad Yoga |
| FPS |
21.0 |
6.3 |
7.9 |
9.0 |
9.1 |
10.9 |
12.2 |
42.8 |
47.4 |
6.1 |
| Score |
530 |
158 |
200 |
226 |
228 |
276 |
208 |
1078 |
1194 |
153 |
| Min FPS |
14.2 |
3.2 |
5.5 |
4.7 |
4.7 |
2.7 |
2.8 |
8.2 |
12.8 |
3.8 |
| Max FPS |
39.6 |
13.5 |
13.9 |
16.1 |
16.0 |
20.6 |
22.1 |
78.8 |
82.7 |
11.5 |
Unigine Valley 1.0
https://unigine.com/products/valley/
| |
Surface Book (1280x720 High) |
Surface Book (1920x1080 High max. 72 °C) |
Surface Book (3000x2000 High) |
TP Yoga 12 Ultra |
TP Yoga 12 High |
X1C3 |
MBP13r2015e High |
MBP13r2015e Med |
asus UX501 High |
ThinkPad Yoga |
| FPS |
42.9 |
23.3 |
7.8 |
7.2 |
8.4 |
8.8 |
9.9-10.2 |
11.8 |
39.5 |
3.7 |
| Score |
1793 |
975 |
326 |
301 |
351 |
367 |
413-427 |
493 |
1653 |
153 |
| Min FPS |
22.3 |
15.1 |
4.4 |
4.3 |
4.8 |
5.1 |
5.1-5.3 |
6.7 |
17.7 |
2.1 |
| Max FPS |
70.9 |
43.1 |
14.4 |
11.5 |
13.5 |
14.4 |
17.2 |
18.1 |
72.8 |
6.7 |
FurMark
http://www.ozone3d.net/benchmarks/fur/
1.17.0.0
720 preset
| |
Surface Book (max. 73 °C) |
ThinkPad Yoga 12 (1.15.1.0) |
X1 Carbon Gen 3 |
Dell E7450 |
Asus UX501 |
X1 Carbon Gen 2 4300U |
ThinkPad Yoga 4200U |
X1 Carbon |
| points |
1161 |
446 |
446 |
507 |
3958 |
346 |
413 |
423 |
| fps |
19 |
7 |
7 |
8 |
65 |
5 |
6 |
7 |
| 60000 ms |
(min:19, max: 21) |
(min 8, max 9 - huh, and avg 7?) |
(min:7, max: 11) |
(min:8, max:10) |
(min:57, max: 80 - options:DynBkg) |
(min:6, max:9) |
(min:7, max:10) |
|
3D Mark
http://www.3dmark.com/
CPU & GPU not recognized, graphics driver not approved
| |
Score |
Graphics |
Physics |
Combined |
| Ice Storm 1.2 |
Surface Book 16551 v1.5.915 64
(TPYoga12 46630 v1.5.884.0)
(X1C3 43935)
(E7450 52816)
(XPS 13 52915 (better than 7% of all results))
(X1C2 39209)
(X1C1 31733) |
Surface Book 15576 (68.1/67.36 fps)
(TPYoga12 51287 (221.31/224.69 fps))
(X1C3 47254 (211.51/199.74 fps))
(E7450 59778 (255.57/264.39 fps))
(XPS 13 61463 (262.79/271.83 fps))
(X1C2 44344 (213.93/175.47 fps))
(X1C1 35603 (168/144 fps)) |
Surface Book 21196 (67.29 fps)
(TPYoga12 35385 (112.33 fps))
(X1C3 35266 (111.96 fps))
(E7450 37523 (119.12 fps))
(XPS 13 35591 (112.99 fps))
(X1C2 27902 (88.58 fps))
(X1C1 22989 (73 fps)) |
|
| Cloud Gate 1.1 |
Surface Book 7741
(TPYoga12 5099)
(X1C3 5022)
(E7450 5306)
(XPS 13 5246)
(X1C2 4083)
(X1C1 3425) |
Surface Book 11236 (46.28/51.72 fps)
(TPYoga12 6478 (28.91/27.47 fps))
(X1C3 6262 (27.85/26.64 fps))
(E7450 28.76/18.42 fps)
(XPS 13 6754 (29.59/29.15 fps))
(X1C2 5066 (22.44/21.63 fps))
(X1C1 4172 (18/19 fps)) |
Surface Book 3707 (11.77 fps)
(TPYoga12 2923 (9.28 fps))
(X1C3 2967 (9.42 fps))
(E7450 3166 (10.05 fps))
(XPS 13 2945 (9.35 fps))
(X1C2 2432 (7.72 fps))
(X1C1 2106 (7 fps)) |
|
| Fire Strike 1.1 |
Surface Book 1900
(TPYoga12 717)
(X1C3 696)
(E7450 742)
(XPS 13 752)
(X1C2 531 (7% of all results))
(X1C1 483) |
Surface Book 2035 (9.96/7.96 fps)
(TPYoga12 772 (3.6/3.15 fps))
(X1C3 748 (3.51/3.03 fps))
(E7450 788)
(XPS 13 810 (3.85/3.25 fps))
(X1C2 592 (2.75/2.42 fps))
(X1C1 532 (2/2 fps)) |
Surface Book 5355 (17.00 fps)
(TPYoga12 3786 (12.02 fps))
(X1C3 4172 (13.25 fps))
(E7450 4507)
(XPS 13 4176 (13.26 fps))
(X1C2 3518 (11.17 fps))
(X1C1 2968 (9 fps)) |
Surface Book 772 (3.59 fps)
(TPYoga12 262 (1.22 fps))
(X1C3 252 1.17fps))
(E7450 276)
(XPS 13 273 (1.27 fps))
(X1C2 182 (0.85 fps))
(X1C1 164 (0.76 fps)) |
| Sky Diver 1.0 |
Surface Book 6129
(TPYoga12 2562)
(X1C3 2539)
(E7450 2718)
(XPS 13 2774) |
Surface Book 6331 (27.63/30.32 fps)
(TPYoga12 2410 (11.45/10.6 fps))
(X1C3 2402 (11.63/10.38 fps))
(E7450 2562 (12.34/11.13 fps))
(XPS 13 2631 (12.89/11.25 fps)) |
Surface Book 4874 (67.3 fps)
(TPYoga12 4049 (71.63 fps))
(X1C3 3835 (73.98 fps 8 threads))
(E7450 4168 (70.94 fps))
(XPS 13 4076 (70.28 fps)) |
Surface Book 7196 (29.62 fps)
(TPYoga12 2384 (9.81 fps))
(X1C3 2358 (9.71 fps))
(E7450 2552 (10.51 fps))
(XPS 13 2597) |
VMD
http://www.ks.uiuc.edu/Research/vmd/
1.9.2 CUDA
DNA
| |
Surface Book |
ThinkPad Yoga 12 |
X1C3 |
Asus UX501 |
Asus UX501 CUDA |
ThinkPad Yoga |
| fps |
59-62 |
2140 |
1750 |
3994 |
60 |
3172 |
Chimera
http://www.cgl.ucsf.edu/chimera/docs/ContributedSoftware/benchmark/benchmark.html
1.10.2
pythonw crashed during solid rendering, max. out RAM and disk at 100%, have to be terminated in taskmgr
molecule benchmark PDB 1f4h
| |
Surface Book |
ThinkPad Yoga 12 (1.10.1) |
X1 Carbon Gen 3 (1.10.1) |
MBP13r2015e |
asus UX501 |
X1 Carbon Gen 2 (1.8.1) |
X1 Carbon (1.7) |
T410 (1.41) |
W520 (1.52) |
| null |
1526.9 |
4513.0 |
4734.8 |
6120.0 |
3777.6 |
2747.2 |
2942.8 |
|
|
| wireframe |
386.5 |
536.7 |
353.0 |
634.2 |
342.4 |
370.8 |
127.6 |
|
196.1 |
| stick |
11.7 |
9.0 |
10.9 |
5.0 |
12.6 |
2.3 |
1.9 |
12.2 |
|
| ball-stick |
11.6 |
8.8 |
10.7 |
5.1 |
12.6 |
2.3 |
1.9 |
12.3 |
32.9 |
| ribbon |
483.7 |
533.5 |
161.0 |
349.8 |
219.5 |
195.5 |
132.8 |
|
|
| sphere |
20.2 |
16.1 |
18.8 |
8.3 |
22.3 |
4.4 |
3.7 |
14.1 |
|
| ops |
81.4 |
90.7 |
89.6 |
75.9 |
106.6 |
92.4 |
78.2 |
|
|
| surface (volume) |
529 |
435 |
259 |
12422 |
359 |
437 |
|
|
|
| mesh |
527 |
433 |
292 |
1043 |
289 |
377 |
|
|
|
| contour |
308 |
271 |
275 |
268 |
303 |
279 |
|
|
|
| solid |
crashed |
crashed |
crashed |
748 |
512 |
560 |
|
|
|
| recolor |
603 |
306 |
293 |
491 |
251 |
278 |
|
|
|
WinSAT
http://en.wikipedia.org/wiki/Windows_System_Assessment_Tool
MB/s
|
Surface Book |
ThinkPad Yoga 12 |
X1 Carbon Gen 3 |
Dell E7450 |
MBP13r2015e i5-5257U 2.7GHz 16GB RAM Parallels VM |
ThinkPad Yoga |
X1 Carbon Gen 2 |
Helix |
X1 Carbon W8E32 |
Taichi |
T430s |
T420s
|
W520 |
T510 |
T400/W500 |
CPU LZW Compression
|
342.62 |
223.87 |
224.28 |
243.04 |
210.4 |
238.02 |
238.65 |
206.07 |
174.59 |
243.92 |
267.54 |
220.56
|
495.30 |
171.94 |
119.46 |
CPU AES256 Encryption
|
1792.68 |
1194.67 |
1240.40 |
1290.37 |
802.01 |
1235.14 |
1263.36 |
100.92 |
83.69 |
117.71 |
129.63 |
106.00 |
228.19 |
77.55 |
62.17 |
CPU Vista Compression
|
883.12 |
619.26 |
616.20 |
664.58 |
555.69 |
636.75 |
637.11 |
553.80 |
601.28 |
650.05 |
719.58+ |
745.99 |
1311.40 |
569.76 |
368.56 |
| CPU SHA1 Hash |
1012.66 |
776.25 |
915.12 |
842.94 |
904.49 |
773.47 |
958.79 |
633.67 |
545.80 |
739.87 |
891.80 |
653.23 |
1397.21 |
420.36 |
568.14 |
Uniproc CPU LZW Compression
|
140.69 |
92.78 |
94.20 |
101.36 |
105.46 |
88.0 |
101.89 |
83.63 |
68.99 |
99.44 |
107.72 |
78.42 |
94.79+ |
69.51 |
61.87 |
| Uniproc CPU AES256 Encryption |
502.98 |
348.78 |
348.94 |
374.74 |
401.22 |
336.45 |
375.10 |
52.10 |
39.29 |
60.44 |
66.43 |
46.34 |
59.53 |
38.03 |
32.76 |
| Uniproc CPU Vista Compression |
365.86 |
246.50 |
248.56 |
267.06 |
279.36 |
226.55 |
263.23 |
208.13 |
237.40 |
243.24 |
273.65 |
261.65 |
251.55+ |
207.42 |
194.03 |
| Uniproc CPU SHA1 Hash |
512.41 |
396.99 |
396.57 |
427.02 |
456.57 |
383.90 |
428.47 |
357.95 |
304.14 |
413.22 |
420.78 |
319.53 |
343.79+ |
238.53 |
297.66 |
| Dshow Video Encode Time (s) |
1.99885 |
2.77823 |
2.78059 |
2.59370 |
2.76760 |
2.70669 |
2.67998 |
2.88483 |
2.75325 |
2.46806 |
2.45161 |
2.61391 |
1.45114 |
3.35620 |
5.31552 |
| Memory Performance |
24221.42 |
15685.87 |
16124.03 |
15918.68 |
20998.80 |
15798.61 |
17305.41 |
12898.00 |
12785.98 |
14939.07 |
15768.97 |
13239.94 |
9235.90+ |
6194.03 |
5322.44 |
GeekBench
http://www.primatelabs.com/geekbench/download/windows/
v3.3.2 x32
| performance |
Surface Book single-core |
Surface Book multi-core |
ThinkPad Yoga 12
single core |
ThinkPad Yoga 12 multi-core |
X1C3
single-core score |
X1C3
multi-core score |
Dell E7450 single |
Dell 7450 multi |
Apple MBP13r (early 2015) single |
Apple MBP13r (early 2015) multi |
Asus UX501 single core |
Asus UX501 multi-core |
X1C2
4300U
single-core |
X1C2
4300U
multi-core |
ThinkPad Yoga
4200U
single |
ThinkPad Yoga
4200U
multi |
| |
3370 |
6991 |
2686 |
5364 |
2738 |
5411 |
2846 |
5661 |
2908 |
6133 |
3299 |
12089 |
2770 |
5289 |
2560 |
4777 |
| integer |
3353 |
7826 |
2649 |
5913 |
2688 |
5948 |
2880 |
6331 |
3009 |
7090 |
3384 |
13871 |
2716 |
5975 |
2454 |
5282 |
| floating point |
3294 |
7776 |
2638 |
5867 |
2678 |
5935 |
2872 |
6388 |
3019 |
7029 |
3396 |
14808 |
2696 |
5752 |
2444 |
5214 |
| memory |
3560 |
3755 |
2860 |
3260 |
3959 |
3292 |
2729 |
2871 |
2487 |
2429 |
2939 |
3091 |
3030 |
2992 |
3004 |
2897 |
PCMark
http://www.futuremark.com/benchmarks/pcmark
PCMark 8 Home
| |
Surface Book (Accelerated OpenCL) |
Surface Book (Conventional 2.5.419) |
ThinkPad Yoga 12 (2.0.228 accelerated 3.0) |
X1C3 (2.4.304) |
| Score |
2922 |
2513 |
3156 |
3085 |
| Test Duration |
39 m 13 s |
33 m 07 s |
35 m 46 s |
35 m 59 s |
| Web Browsing - JunglePin |
0.38424 s |
0.38293 s |
0.32406 s |
0.32439 s |
| Web Browsing - Amazonia |
0.16389 s |
0.16361 s |
0.13418 s |
0.13423 s |
| Writing |
5.86848 s |
5.88563 s |
4.5 s |
4.4 s |
| Casual Gaming |
33.26 fps |
33.16 fps |
26 fps |
26 fps |
| Video Chat v2 / Video Chat playback 1 v2 |
30.01 fps |
29.99 fps |
30 fps |
30 fps |
| Video Chat v2 / Video Chat encoding v2 |
64.00000 ms |
99.00000 ms |
82 ms |
84 ms |
| Advanced Photo Editing part 1 |
0.29573 s |
0.58725 s |
0.24269 s |
0.28395 s |
SiSoftware Sandra
http://www.sisoftware.co.uk/
2015-SP1a 21.32.2015.3
| |
Surface Book 2015 SP3 2147 |
ThinkPad Yoga 12 2015-SP1a 21.32.2015.3 |
X1C3 |
ThinkPad Yoga
4200U**
2014.05.20.28 |
ThinkPad Yoga
4300U* |
X1 Carbon Gen 2
4300U |
X1 Carbon W8E32 |
T430s W7E64 SSD |
T420s W7E64 SSD |
W520 W8E64 SSD |
| Score kPT |
9.98 |
7.63 |
7.65 |
3.20 |
3.95/4.02 |
3.27 |
3.98 |
4.17
4.36 (2012-1845) |
4.18 |
7.04 |
| Aggregate Native Performance GOPS |
50.73 |
40.71 |
40.81 |
|
|
|
34.75 |
49.22 |
43.19 |
80.87 |
| Aggregate Multi-Media Native Performance MPix/s |
134.36 |
92.15 |
92.33 |
|
|
|
64.88 |
111.00 |
98.06 |
185.78 |
| Cryptographic Bandwidth GB/s |
3.735 |
2.930 |
2.935 |
|
|
|
0.763 |
1.32 |
1.138 |
1.937 |
| Aggregate Option Pricing Performance kOPT/s |
8.47 |
6.67 |
6.65 |
|
|
|
|
|
|
|
| Aggregate Scientific Performance GFLOPS |
11.88 |
10.16 |
10.62 |
|
|
|
|
|
|
|
| Aggregate .NET Performance GOPS |
15.20 |
10.86 |
10.79 |
|
|
|
10.53 |
13.14 |
12.59 |
22.44 |
| Aggregate Memory Performance GB/s |
19.203 |
18.596 |
18.435 |
|
|
|
16.231 |
10.748 |
12.341 |
17.191 |
| Memory Latency ns |
44.3 |
30.4 |
28.9 |
|
|
|
55.1 |
26.6 |
26.6 |
29.2 |
| Drive Score IOPS MB/s |
489.389 |
434.360 |
435.597 |
|
|
|
396.608 |
422.204 |
420.774
(60.298 HDD 2011?) |
506.368 |
| Device Score IOPS |
12271.3 |
12624.0 |
12871.8 |
|
|
|
10440.2 |
4162.3 |
9995.9 |
15286.9 |
| Aggregate Shader Performance MPix/s (GP (GPU/CPU/APU) |
193.89 |
91.16 |
89.12 |
|
|
|
126.61 |
73.95 |
32.48 |
126.40 |
| Aggregate Option Pricing Performance kOPT/s (GP) |
244.57 |
85.75 |
86.52 |
|
|
|
|
|
|
|
| Aggregate Scientific Performance GFLOPS (GP) |
109.91 |
39.48 |
38.72 |
|
|
|
|
|
|
|
| Aggregate Memory Performance GB/s (GP) |
6.941 |
10.212 |
9.856 |
|
|
|
6.474 |
5.850 |
5.855 |
11.026 |
2014 SP1C 20.25 -
* didn't completely finished test first time. mouse crashed on second time.
** Aggregate Memory not reported, OpenCL error 339
PassMark
http://www.passmark.com/
v8 build 1052
* DirectX 10 graphics test (one with tree) seems to hang, esc goes on to next (repeat twice got it going, got message 1680x1050 resolution failed)
| |
Surface Book |
ThinkPad Yoga 12 (v8 b1046) |
X1 Carbon Gen 3 |
Dell E7450 |
Asus UX501 |
X1 Carbon Gen 2 4300U Intel 240GB |
ThinkPad Yoga 4200U Samsung 128GB |
X1 Carbon W8E32 (v8) |
T430s (v7) |
T420s (v7) |
| Rating |
3212 |
2026.1 |
2094.7 |
2136.7 |
3423.1 |
1764.5 |
1954.7 |
1558.1 |
1548.9 |
1061.1 |
| CPU Mark |
4788 |
3893 |
3921 |
4114 |
8905 |
3177 |
3574 |
2592 |
4535.0 |
3099.7 |
| 2D Graphics Mark |
477.6 |
513 |
542 |
567 |
587 |
485.6 |
575 |
454 |
433.0 |
356.8 |
| 3D Graphics Mark |
10341* |
566 |
577 |
594 |
1205 |
423.2 |
519 |
432 |
478.2 |
300.7 |
| Memory Mark |
1998 |
1929 |
2012 |
1959 |
2229 |
1770 |
1864 |
1254 |
1324.5 |
948.2 |
| Disk Mark |
6929 |
2814 |
3088 |
2786 |
10362 |
4442 |
2527 |
3451 |
792.5 |
462.1 |
IntelBurnTest
http://www.xtremesystems.org/forums/showthread.php?197835-IntelBurnTest-The-new-stress-testing-program
v2.54
| |
Surface Book |
ThinkPad Yoga 12 |
X1 Carbon Gen 3 |
Dell XPS 13 5200U |
MBP13r2015e VM |
Asus UX501 |
X1 Carbon Gen 2 4300U |
ThinkPad Yoga
4200U |
X1 Carbon
W8E32 (v2.54) |
T430s (v2.53) |
T420s (v2.53) |
| Linepack (GFlops) |
41.0359-46.9162 |
32.6463-33.5862 |
32.4892-36.3534 |
34.6988-35.6970 |
30.5470-38.5278 |
69.7684-75.0862 |
24.2526-27.5642 |
29.4538-32.9418 |
26.6-26.9 |
~35-36 |
~28-29 |
| time (s) |
19.053-21.783 |
26.615-27.381 |
24.589-27.513 |
25.013-25.761 |
23.201-29.263 |
11.905-12.812 |
32.429-36.857 |
27.135-30.349 |
33.2-33.5 |
|
|
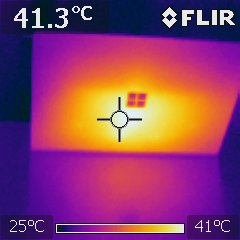
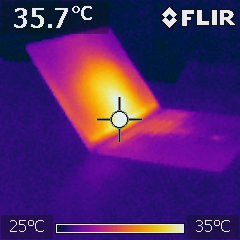
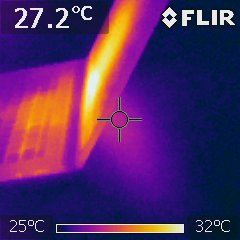
Thermal
FLIR i7 thermal camera - http://www.flir.com/thermography/americas/us/view/?id=54156
during IntelBurnTest
front
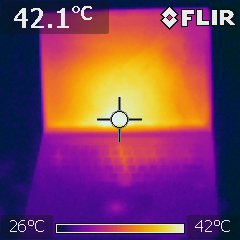
back
left
right
SSD
Samsung MZFLV256 NVMe
237GB capacity, 216GB free, 20.3GB used, 18.8GB system and reserved, 1.34GB apps and games
CrystalDiskInfo
http://crystalmark.info/software/CrystalDiskInfo/index-e.html
both 6.5.2 or 6.6 alpha 1
don't work - disk not found
CrystalDiskMark
http://crystalmark.info/software/CrystalDiskMark/index-e.html
5.0.2 x64
(other data from 3.x)
| |
Surface Book |
5.x |
ThinkPad Yoga 12 |
X1 Carbon Gen 3 |
Dell E7450 |
Dell XPS 13 |
Asus UX501 |
Yoga |
3.03 X1 Carbon Gen 2 |
3.02e Helix |
3.02e-X1 Carbon Win8E32 |
3.01-X1 Carbon Win7-64 W520 Intel 520 |
3.01-Win7-64 T430s Samsung 830 |
| [MB/s] |
Read |
Write |
|
|
Read |
Write |
Read |
Write |
Read |
Write |
Read |
Write |
Read |
Write |
Read |
Write |
Read |
Write |
Read |
Write |
Read |
Write |
Read |
Write |
Read |
Write |
| Seq |
891.0 |
303.7 |
|
|
523.4 |
238.1 |
529.3 |
241.6 |
490.5 |
264.1 |
476.9 |
265.6 |
1391 |
1401 |
503.4 |
418.0 |
482.6 |
318.2 |
445.8 |
183.5 |
429.6 |
178.1 |
433.4 |
247.1 |
487.9 |
403.5 |
| 512K |
|
|
|
|
439.7 |
241.6 |
431.7 |
240.9 |
387.7 |
258.4 |
385.5 |
265.1 |
1004 |
1264 |
377.7 |
402.8 |
421.9 |
312.6 |
339.4 |
194.1 |
375.2 |
177.1 |
353.5 |
239.0 |
342.6 |
389.2 |
| Seq Q32T1 |
1574 |
308.4 |
|
|
|
|
|
|
|
|
|
|
|
|
|
|
|
|
|
|
|
|
|
|
|
|
| 4K |
40.51 |
108.1 |
|
|
35.78 |
103.4 |
35.83 |
103.2 |
23.09 |
97.25 |
21.27 |
97.20 |
40.20 |
90.03 |
33.95 |
86.38 |
38.81 |
99.90 |
21.42 |
43.33 |
19.66 |
41.43 |
19.67 |
48.08 |
22.34 |
55.89 |
| 4K QD32 |
|
|
|
|
391.3 |
240.9 |
354.8 |
240.1 |
393.1 |
255.7 |
386.8 |
263.5 |
311.0 |
316.7 |
326.8 |
291.9 |
201.1 |
124.1 |
266.2 |
167.4 |
132.7 |
174.2 |
229.7 |
231.6 |
303.6 |
151.3 |
| 4K Q32T1 |
402.2 |
270.2 |
|
|
|
|
|
|
|
|
|
|
|
|
|
|
|
|
|
|
|
|
|
|
|
|
Anvil's Storage Utilities
http://www.thessdreview.com/daily-news/latest-buzz/anvil-storage-utilities-releases-new-storage-and-ssd-benchmark/
1.1 2014
| |
Surface Book |
ThinkP Yoga 12 |
X1 Carbon Gen 3 |
Asus UX501 |
ThinkPad Yoga 128GB Samsung |
256GB Lite-On 4200U |
Intel 240GB 4300U |
X1C2 128GB Samsung 4200U |
| |
2783.68 |
4040.50 |
4072.80 |
6089.61 |
2994.40 |
3499.14 |
3,292.61 |
2699.12 |
| Read |
2649.75 |
2049.63 |
2096.87 |
3484.81 |
1899.34 |
1719.02 |
1,879.18 |
1717.11 |
| Write |
133.93 |
1990.87 |
1975.93 |
2604.80 |
1095.05 |
1780.11 |
1,413.43 |
982.01 |
AS SSD
http://alex-is.de/PHP/fusion/downloads.php?download_id=9
1.7.4739.38088
| |
Surface Book |
ThinkPad Yoga 12 |
X1 Carbon Gen 3 |
Dell XPS 13 |
Asus UX501 |
X1 Carbon Gen 2 4200U Samsung 128 |
ThinkPad Yoga
128GB Samsung MZ7TD128HAFV |
ThinkPad Yoga 256GB Lite-On LCS-256M6S |
X1 Carbon Gen 2 4200U LiteOn 256 LGT-256M6G |
X1 Carbon Gen 2 4300U Intel 240 |
Sony VAIO Pro 13 |
Helix |
X1 Carbon W8E32 Intel 521 |
Taichi DH71 W8-64 SanDisk X100 256 |
T420s W7E64 SSD Crucial m4 256 |
W520 W8E64 SSD Samsung 840 Pro 256 |
| |
Read |
Write |
Read |
Write |
Read |
Write |
Read |
Write |
Read |
Write |
Read |
Write |
Read |
Write |
Read |
Write |
Read |
Write |
Read |
Write |
Read |
Write |
Read |
Write |
Read |
Write |
Read |
Write |
Read |
Write |
Read |
Write |
| Seq MB/s |
1166.76 |
89.87 |
506.39 |
231.20 |
507.90 |
230.54 |
478.43 |
249.45 |
1392.53 |
1102.09 |
497.32 |
127.20 |
507.95 |
125.24 |
487.51 |
412.39 |
483.63 |
405.74 |
502.41 |
301.85 |
1103.7 |
702.45 |
431.23 |
191.37 |
460.82 |
144.24 |
425.79 |
334.97 |
497.34 |
236.56 |
495.07 |
428.16 |
| 4K MB/s |
37.53 |
0.90 |
32.50 |
88.29 |
32.38 |
88.31 |
20.70 |
83.58 |
35.23 |
76.57 |
23.49 |
68.92 |
27.64 |
80.15 |
31.42 |
73.90 |
27.92 |
59.28 |
21.08 |
87.71 |
28.19 |
72.68 |
19.37 |
46.60 |
17.71 |
36.66 |
19.94 |
37.80 |
15.77 |
47.41 |
20.96 |
56.06 |
| 4K-64 Thrd MB/s |
590.97 |
40.25 |
343.04 |
158.41 |
287.56 |
165.22 |
396.22 |
125.14 |
818.06 |
365.57 |
312.66 |
94.40 |
316.32 |
97.27 |
302.24 |
254.33 |
214.31 |
193.71 |
209.83 |
213.81 |
408.85 |
225.73 |
260.56 |
116.36 |
132.65 |
131.29 |
300.55 |
158.42 |
177.53 |
168.36 |
379.90 |
247.79 |
| Acc.time ms |
0.052 |
4.333 |
0.061 |
0.038 |
0.055 |
0.038 |
0.157 |
0.040 |
0.048 |
0.048 |
0.032 |
0.052 |
0.078 |
0.042 |
0.058 |
0.049 |
failed |
failed |
0.151 |
0.231 |
0.087 |
.055 |
0.122 |
0.362 |
0.195 |
0.284 |
0.134 |
0.100 |
0.124 |
0.522 |
0.113 |
0.044 |
| Score |
745 |
50 |
426 |
270 |
371 |
277 |
465 |
234 |
993 |
552 |
386 |
176 |
395 |
190 |
382 |
369 |
291 |
294 |
281 |
332 |
547 |
369 |
323 |
182 |
196 |
182 |
363 |
230 |
243 |
239 |
450 |
347 |
| |
1133 |
835 |
930 |
2044 |
748 |
777 |
955 |
739 |
754 |
1183 |
664 |
470 |
780 |
599 |
1029 |
ATTO Disk Benchmark
http://www.attotech.com/products/product.php?sku=Disk_Benchmark
BlackMagic
https://www.blackmagicdesign.com/products/intensity/software
Disk Speed Test
10.5 2015/09/02
cannot run correctly at 200%, text too big. read test starts at 300, then 600, 900, cap at 1100 each time runs
USB 3.0
SSD to internal SSD
max.
293 MBps transfer
314 MBps write
306 MBps read
to/from external Samsung 840 EVO 250GB SATA-III ASMT 2105 SCSI UASP StarTech enclosure http://www.startech.com/HDD/Enclosures/USB-3-SATA-III-Hard-Drive-Enclosure-UASP-Support~S2510BPU33
and Seagate Fast 4TB
http://www.seagate.com/external-hard-drives/portable-hard-drives/performance/backup-plus-fast-hdd/
GPU-Z
http://www.techpowerup.com/gpuz/
0.8.5
Wireless
Marvell AVASTAR Wireless-AC
Netgear Nighthawk R7500 AC2350 (600+1733 Mbps) http://downloadcenter.netgear.com/en/product/R7500 wave 2 Quantenna chipset firmware 1.0.0.46 -> 1.0.0.82 http://downloadcenter.netgear.com/en/product/R7500 -
max. 497Mbps/56.3MBps - download from QNAP 4 (5-8 of 8 bays) SSD (2x 850 Pro 512 + 2x MX100 CT512) RAID6 TVS-871 (i7-4790S, 16GB, QTS 4.1.3 build 20150313) https://www.qnap.com/i/en/product/model.php?II=160
max. 566Mbps/64.7MBps (66.14MBps on server side) - upload to OCZ Vertex 460A + MX200 CT250 + SanDisk XPS240Gx2
Netgear Nighthawk R7000 AC 1900 (600+1300) (firmware V1.0.3.24_1.1.20) 802.11ac http://www.netgear.com/home/products/networking/wifi-routers/R7000.aspx
max. 234Mbps/27.1MBps - download from QNAP 6x Seagate ST3000DM001-9YN1CC4H RAID6 TS-659 Pro II 1GB, QTS 4.1.3 build 20150313) or Synology DiskStation DS1511+ Atom D525 1.8GHz 1GB DSM 5.1-5004 SHR 5x ST2000DL003-9VT166
TamoSoft Throughput Test
Ver. 1.0 Build 28
http://www.tamos.com/products/throughput-test/
server: ThinkPad Yoga on Ethernet w/ Belkin GigE USB 3.0
client crashes after few minutes
| |
Surface Book |
ThinkPad Yoga 12 |
X1C3 |
MBP13r2015e |
| TCP Up (Mbps) |
112.24 |
82.83 |
106.29 |
58.43 |
| TCP Down (Mbps) |
120.03 |
87.14 |
123.89 |
78.52 |
| UDP Up (Mbps) |
149.07 - Loss 32.7% |
72.68 - Loss 0.1% |
117.71 - Loss 0.0% |
64.45 - Loss 31.4% |
| UDP Down (Mbps) |
149.21 - Loss 78.9% |
93.70 - Loss 87.9% |
141.09 - Loss: 81.5% |
157.95 - Loss 83.7% |
| Rout-trip time RTT (ms) |
2.9 |
5.2 |
2.1 |
3.6 |
Speedtest
http://www.speedtest.net/
SD
Samsung Pro 64GB MicroSD XC read 90MB/s. write 80MB/s UHS-1 Class 10 MB-MG64DA/DM with SD adapter
<84.4MBps transfer, burst 208MBps write to internal
SunSpider
http://www.webkit.org/perf/sunspider/sunspider.html
1.0.2
| ms |
Surface Book |
ThinkPad Yoga 12 |
X1C3 |
Dell E7450 |
Apple MBP13r (early 2015) |
Asus UX501 |
ThinkPad Yoga S1 |
X1 Carbon Gen 2 |
X1 Carbon W8E32 |
Taichi W8-64 |
T430s W7E32 HDD |
T420s W7E32 mSATA |
W520 W8E64 SSD |
| Edge |
93.9 |
|
|
|
|
|
|
|
|
|
|
|
|
| IE |
92.6
(11.0.10240.16431 11.0.22)
|
111.3 |
124.4 (11.0.9600.17728) |
103.7 |
|
87.1 |
105.8 |
113.5 (11.0.9600.16521 update 11.0.4) |
141.7 (10 desktop) |
120.6 (10 desktop) 129.9 (10 metro) |
183.9 (9) |
203.3 (9) |
113.0 (10 desktop) |
| FF |
216.9 (42.0) |
192.4 |
192.6 |
212.7 |
160.4 (37.0.1)
154.5 (31.6.0 ESR) |
170.8 |
181.2 (28.0 no addons/plugins)
191.2 (27.0.1) |
|
231.6 (19.0.1) |
211.4 (19.0.1) |
188.7 (19.0) |
203.1 (19.0) |
197.7 (19.0.1) |
| Chrome |
|
213.9 |
206.6 (42.0.2311.90m) |
220.0 |
180.3 (41.0.2272.118) |
|
194.1 |
|
204.8 (25.0.1364.97) |
190.2 (25.0.1364.97) |
175.3 (25.0.1364.97) |
194.7 (25.0.1364.97) |
169.2 (25.0.1364.152) |
| Safari |
|
|
|
|
139.6 (8.0.5) |
|
|
|
|
|
|
|
|
JetStream
http://browserbench.org/JetStream/
| ms |
Surface Book Geometric Mean |
Surface Book Latency |
Surface Book Throughput |
| Edge |
186.41 ± 28.469 |
149.22 ± 44.702 |
221.75 ± 7.7656 |
| IE |
|
|
|
| FF 42.0 |
162.67 ± 4.4407 |
80.454 ± 1.9045 |
280.28 ± 11.654 |
| Chrome |
|
|
|
| Safari |
|
|
|
| Vivaldi |
|
|
|
CPU-Z
http://www.cpuid.com/softwares/cpu-z.html
1.7.4 crashed at 22-25%
HWInfo
http://www.hwinfo.com/
5.06
Monitor - Panasonic MEI96A2 VVX14P048M00
Battery #0 - SMP 51000 mWh, FCC 53190 mWh
Battery #1 - DYN 17902 mWh, FCC 18772 mWh
Spec
- 3.48 lb (0.88:1 1.57 lb: 1.77lb clipboard : base ?)
- Laptop: 9.14 x 12.30 x 0.51- 0.90 in ( 232.1 x 312.3 x 13 -22.8 mm) Clipboard: 8.67 x 12.30 x 0.30 in (220.2 x 312.3 x 7.7 mm)
- 3000x2000 (267 PPI) 13.5" PixelSense, Aspect ratio: 3:2, optically bonded, 10 point multi-touch
- i5-6200U HG Graphics 520 besides i7
- NVIDIA GeForce (Maxwell) 1GB GDDR5
- Casing - magnesium alloy
- Color - Silver
- backlit keyboard - 1.6mm travel key stroke
- precision glass touchpad, 5 point touch
- Physical buttons - Volume, Power
- 1024 levels of pressure sensitivity pen (AAAA battery) with eraser, 2nd button, connect/battery low LED, Palm Block (works with other Surface devices)
- Surface Connect (can be charge with Surface Prro 3 power supplly)
- 802.11ac
- Bluetooth 4.0
- Two full-size USB 3.0
- Full-size SD
- Headset jack
- Mini DisplayPort 1.2a
- 5.0 megapixel front-facing camera , 8.0 megapixel rear-facing camera with autofocus, with 1080p HD 16:9 video recording, Windows Hello compatible with IR face-detection sensor, privacy light
- Dual Microphones, front and rear facing, noise cancellation
- Front-facing stereo speakers with Dolby audio
- Up to 12 hours of video playback
- Ambient light sensor • Accelerometer • Gyroscope • Magnetometer
- Windows 10 Pro
- Office 30-day trial
- Warranty - 1-year limited
Price
- $1499 8/128/i5
- $1699 8/128/i5/dGPU
- $1699 8/256/i5
- $1899 8/256/i5/dGPU
- $2099 8/256/i7/dGPU
- $2699 16/512/i7/dGPU
- $3199 16/1TB/i7/dGPU
education discount 10%
Accessories
- Microsoft Surface Dock
- 2 Mini DisplayPorts
- 1 Gigabit Ethernet port
- 4 USB 3.0 ports
- 1 Audio out port
- Surface Connect cable
- External power supply
- $199.99
- Pen tip kit (4 tips: 2H, H, HB, B) $10.00
- Mini DisplayPort to HDMI Adapter $39.99
- Mini DisplayPort to VGA Adapter $39.99
- Microsoft Complete Accident Protection for Surface Book (2 year, 2 claims, $49 deductible) $249
Bluetooth
Marvell AVASTAR Bluetooth
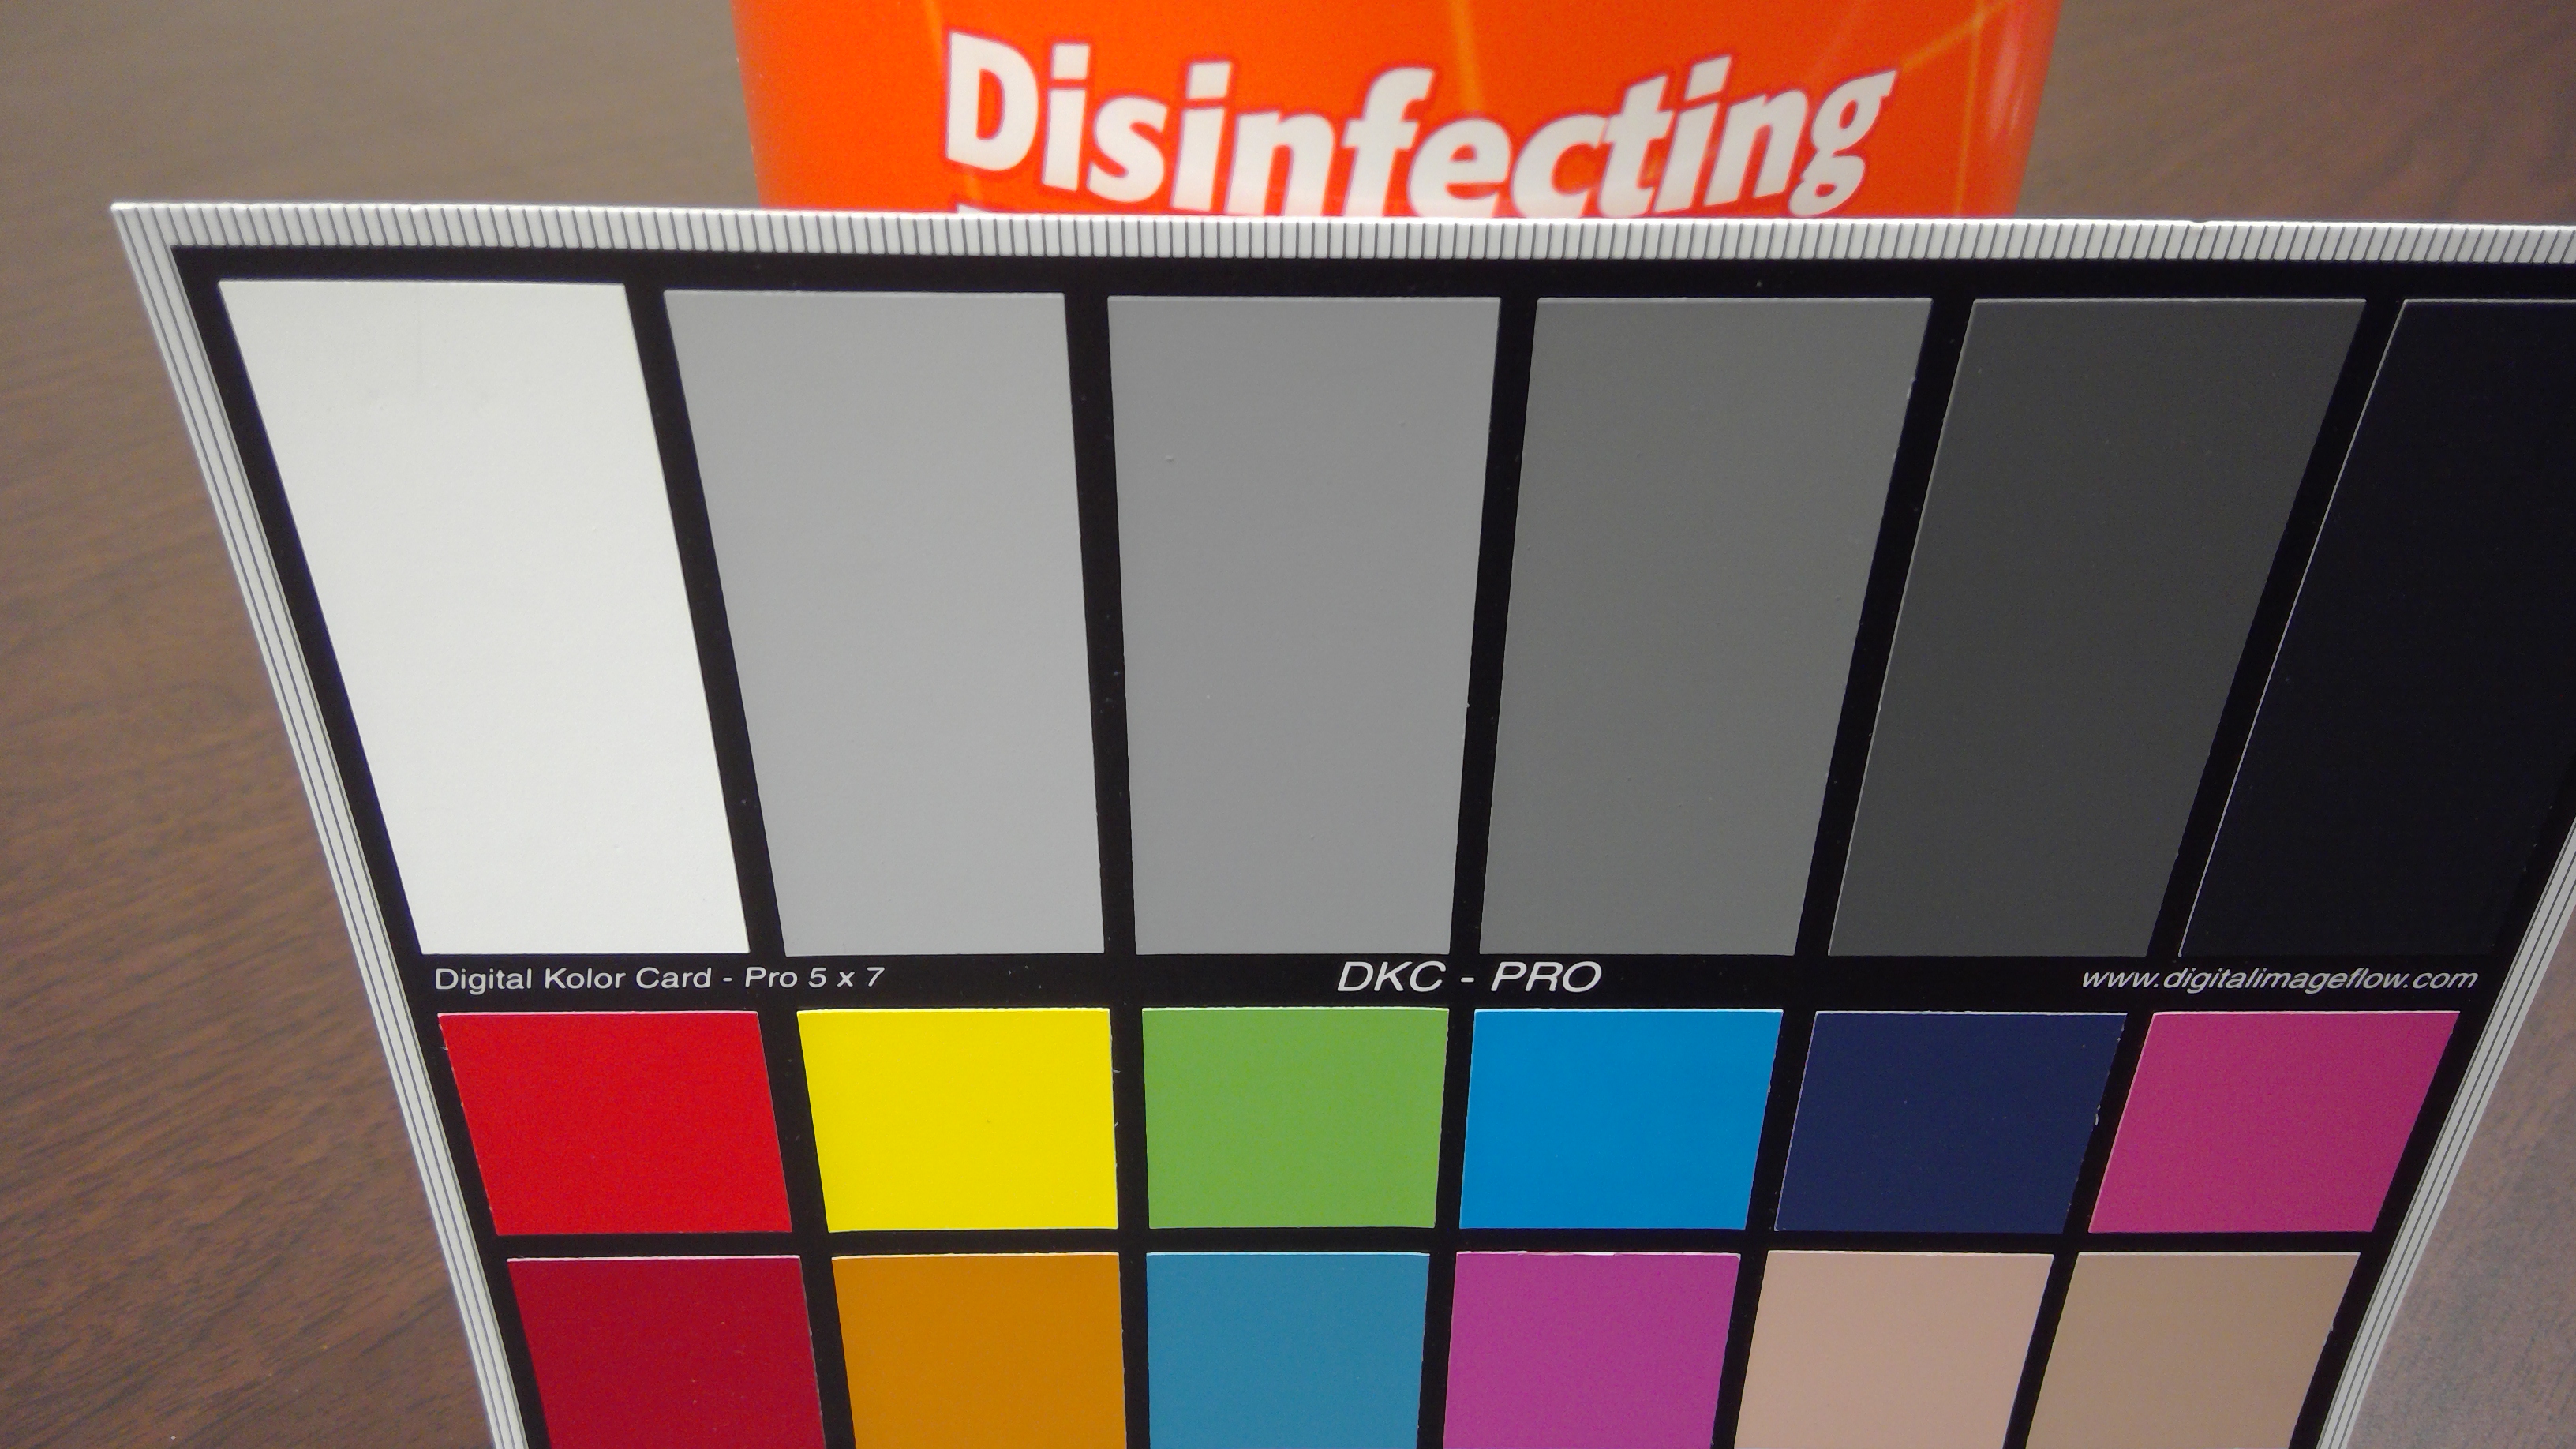
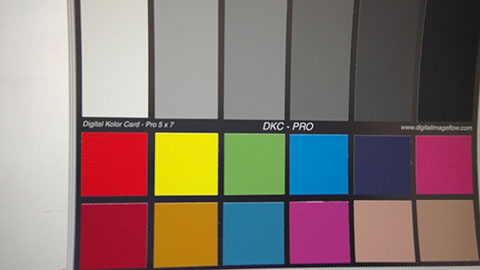
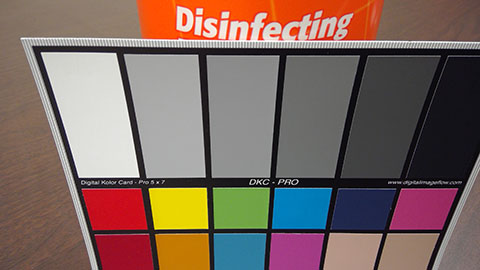
Camera
indoor fluorescent lights
DKC-Pro - Digital Kolor Card Pro - digitalimagflow.com (defuncted) http://www.dgkcolortools.com/dkc-pro-multifunction-color-tool.html
click to see full images
front
back
Audio
Realtek SST
DPC Latency Checker
http://www.thesycon.de/deu/latency_check.shtml
1.3.0
setup failed - InstallDrv: DeleteFile failed with error 0x00000005
Security
TPM 2.0
Sensors
Sdo sensor V2?
Device Manager
it is a very long one
Apps
it is a very long too
Surface App
adjust pen pressure sensitivity
Battery
powercfg /batteryreport
SYSTEM PRODUCT NAME Microsoft Corporation Surface Book
BIOS 88.822.769 09/22/2015
OS BUILD 10240.16545.amd64fre.th1.150930-1750
PLATFORM ROLE Mobile
CONNECTED STANDBY Supported
|
BATTERY 1 |
BATTERY 2 |
| NAME |
X906971 |
X906980 |
| MANUFACTURER |
DYN |
SMP |
| CHEMISTRY |
LION |
LION |
| DESIGN CAPACITY |
17,902 mWh |
51,000 mWh |
| FULL CHARGE CAPACITY |
18,945 mWh |
53,175 mWh |
initial Design Capacity: 68892-68902 mWh, FCC 72308-73241 mWh
playing 2560x1440 videos in VLC - 5 hours
Design Capacity: 68902 mWh - 4h52m45s
FCC 72209 mWh - 5h06m48s
playing DVD (only <6% screen)
to charge back to 100% full
References: