
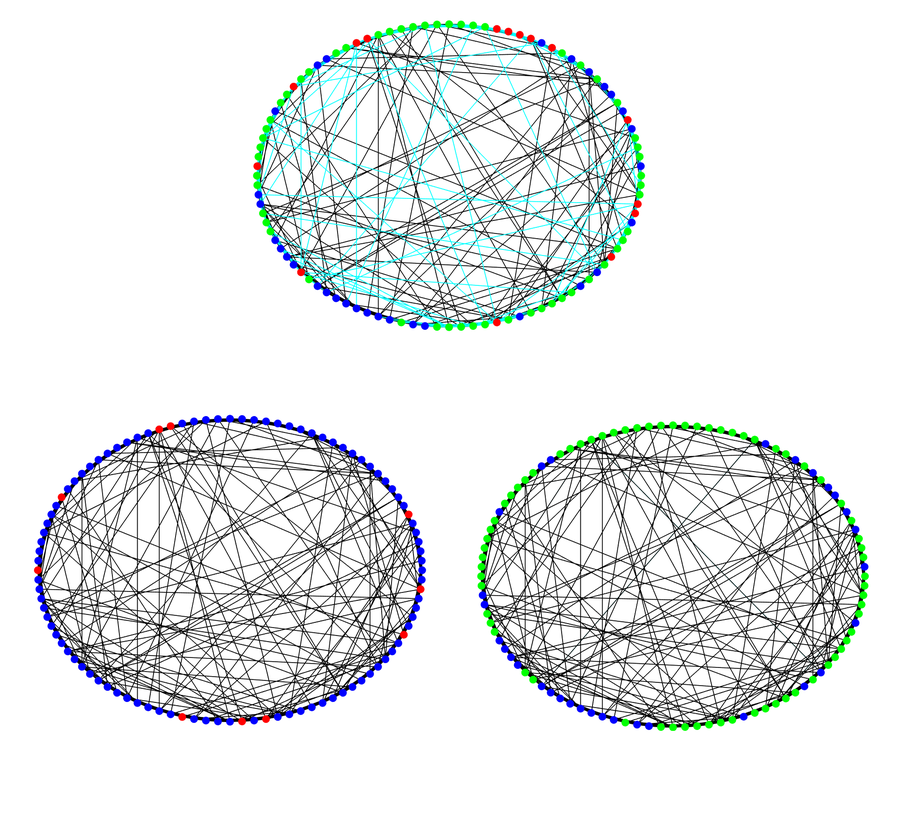
With Hannah Scanlon, I studied an SIR epidemic model on an adaptive network in which people temporarily deactivate potentially infectious contacts and later restore those same relationships after recovery. The goal was to build behavioral feedback into an epidemic model without assuming that social contacts are permanently rewired or that the population is perfectly mixed.
Network dynamics
The underlying contact structure is a Watts–Strogatz small-world graph \(G=(V,E)\). Each node is in one of the states \(S\), \(I\), or \(R\). Infection and recovery occur with probabilities proportional to \(\beta\Delta t\) and \(\gamma\Delta t\), while an active susceptible–infected edge is temporarily deactivated with probability \(p\Delta t\). Once the infectious risk disappears, deactivated edges reconnect at rate \(r\).
If \(A\) is the fixed adjacency matrix and \(D\) records temporarily deactivated links, the infection probability for a susceptible node \(i\) over one time step is
\[ P(V_i^{k+1}=I\mid V_i^k=S) =\beta\Delta t\,(I^k)^T(A-D^k)e_i. \]The network snapshots show the same contact graph before, during, and after an outbreak. Black edges are active, cyan edges are temporarily deactivated, and node colors indicate disease status. Together they illustrate how temporary behavioral changes reshape the effective transmission network while preserving the underlying social contacts.
Mean-field equations
To make the system amenable to analysis, we derive an ODE approximation for expected node and edge counts. The node equations are
\[ \dot S=-\beta[SI],\qquad \dot I=\beta[SI]-\gamma I,\qquad \dot R=\gamma I. \]The edge equations distinguish active and deactivated links. For example,
\[ \dot{[SI]}=\beta[SSI]-\beta([SI]+[ISI])-(\gamma+p)[SI], \] \[ \dot{[SI_d]}=p[SI]-\gamma[SI_d]-\beta[ISI_d]. \]Triples are closed using the homogeneous-degree moment approximation
\[ [ABC]\approx\frac{\langle k\rangle-1}{\langle k\rangle} \frac{[AB][BC]}{[B]}. \]Epidemic thresholds beyond \(R_0\)
Linearization at the disease-free state recovers the familiar network reproduction number
\[ R_0=\frac{\beta\langle k\rangle}{\gamma}. \]However, \(R_0\) alone does not measure the effect of adaptive link deactivation. By examining higher derivatives of the infected and susceptible populations at the beginning of an outbreak, we obtain additional critical deactivation rates, including
\[ p_1^*=\beta\left(\frac{\langle k\rangle}{2}-\frac32\right)-\gamma, \]and
\[ p_2^*=p_1^*-\gamma+\frac{\gamma^2}{\beta\langle k\rangle}. \]These thresholds identify parameter regimes in which an epidemic may initially grow because \(R_0>1\) but is nevertheless strongly suppressed by behavioral adaptation.
\[\dot S=-\beta[SI],\qquad \dot I=\beta[SI]-\gamma I,\qquad \dot R=\gamma I.\]\[[ABC]\approx\frac{\langle k\rangle-1}{\langle k\rangle}\frac{[AB][BC]}{[B]}.\]\[R_0=\frac{\beta\langle k\rangle}{\gamma}.\]\[p_1^*=\beta\left(\frac{\langle k\rangle}{2}-\frac32\right)-\gamma,\qquad p_2^*=p_1^*-\gamma+\frac{\gamma^2}{\beta\langle k\rangle}.\]Reference
- Scanlon, H., & Gemmer, J. (2021). Epidemic Conditions with Temporary Link Deactivation on a Network SIR Disease Model. Spora: A Journal of Biomathematics 7, 72–85.